Earth’s Internal Temperature
The evidence of Earth’s internal heat is everywhere: volcanoes, hot springs, and the elevated temperatures measured in mines and boreholes. Earth’s internal heat fuels convection in the mantle, which drives the plate tectonic system, as well as the geodynamo in the core, which produces Earth’s magnetic field.
Earth’s internal heat engine is powered by several sources. During the planet’s violent origin, kinetic energy released by impacts with planetesimals heated its outer regions, while gravitational energy released by differentiation of the core heated its deep interior (see Chapter 9). The decay of radioactive isotopes in Earth’s interior continues to generate heat.
After Earth formed, it began to cool, and it is cooling to this day as heat flows from the hot interior to the cool surface. The temperatures in the planet’s interior result from a balance between heat gained and heat lost.
Heat Flow Through Earth’s Interior
Earth cools in two main ways: through the slow transport of heat by conduction and through the more rapid transport of heat by convection. Conduction dominates in the lithosphere, whereas convection is more important throughout most of Earth’s interior.
391
Conduction Through the Lithosphere
Heat energy exists in a material as vibrations of atoms; the higher the temperature, the more intense the vibrations. The conduction of heat occurs when thermally agitated atoms and molecules jostle one another, mechanically transferring kinetic energy from a hot region to a cool one. Heat is transferred from regions of high temperature to regions of low temperature by this process.
Materials vary in their ability to conduct heat. Metal is a better conductor than plastic (think of how rapidly a metal handle on a frying pan heats up compared with one made of plastic). Rock and soil are very poor heat conductors, which is why underground pipes are less susceptible to freezing than those above ground. Rock conducts heat so poorly that a lava flow 100 m thick takes about 300 years to cool from 10008C to ground surface temperatures. Moreover, the cooling time of a layer increases with the square of its thickness, so a lava flow twice as thick (200 m) would take four times as long to cool (about 1200 years).
The conduction of heat through the outer surface of the lithosphere causes the lithosphere to cool slowly over time. As it cools, its thickness increases, just as the cold crust on a bowl of hot wax thickens over time. Rock, like wax, contracts and becomes denser with decreasing temperature, so the average density of the lithosphere must increase over time, and therefore, according to the principle of isostasy, its surface must sink to lower levels. Thus, the mid-ocean ridges stand high because the lithosphere there is young, hot, and thin, whereas the abyssal plains are deep because the lithosphere there is old, cold, thick, and dense.
From these principles, geologists have constructed a simple but precise theory of seafloor topography that uses conductive cooling to explain the large-scale features of ocean basins. The theory predicts that ocean depth should depend primarily on the age of the seafloor. Because the cooling depth goes as the square-root of cooling time, ocean depth should increase as the square-root of seafloor age. In other words, seafloor that is 40 million years old should have subsided twice as much as seafloor that is only 10 million years old (because 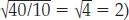 . This simple mathematical relationship matches seafloor topography near the mid-ocean ridge crests amazingly well, as demonstrated in Figure 14.9.
Conductive cooling of the lithosphere accounts for a wide variety of other geologic phenomena, including the subsidence of passive continental margins and thermal subsidence basins (see Chapter 5). It explains why the amount of heat flowing out of oceanic lithosphere is high near spreading centers and decreases as the oceanic lithosphere gets older, and it tells us why the average thickness of the oceanic lithosphere is about 100 km. The establishment of this theory was one of the great successes of plate tectonics.
Conductive cooling does not explain all aspects of heat flow through Earth’s outer surface, however. Marine geologists have found that seafloor older than about 100 million years does not continue to subside as the simple theory would predict. Moreover, simple conductive cooling is far too inefficient to account for the cooling of Earth over its entire history. It can be shown that if the 4.5-billion-year-old Earth cooled by conduction alone, very little of the heat from depths greater than about 500 km would have reached the surface. The mantle, which was molten in Earth’s early history, would be far hotter than it is now. To understand these observations, we must consider the second mode of heat transport, convection, which is more efficient than conduction in getting heat out of Earth’s interior.
392
Convection in the Mantle and Core
When a fluid—either liquid or gas—is heated, it expands and rises because it has become less dense than the surrounding material. The upward movement of the heated fluid displaces cooler fluid downward, where it is heated and then rises to continue the cycle. This process, called convection, transfers heat more efficiently than conduction because the heated material itself moves, carrying its heat with it. Convection is the same process by which water is heated in a kettle on the stove (see Figure 1.16). Liquids conduct heat poorly, so a kettle of water would take a long time to boil if convection did not distribute the heat rapidly. Convection is what moves heat when a chimney draws, when warm tobacco smoke rises, or when thunderclouds form on a hot day.
We have already seen how seismic waves revealed that Earth’s outer core is liquid. Other types of data demonstrate that the iron-rich material in the outer core has a low viscosity and can therefore convect very easily. Convective movement in the outer core distributes heat through the core very efficiently, and it generates Earth’s magnetic field, a phenomenon we will examine in more detail later in this chapter. At the core-mantle boundary, heat from the core flows into the mantle.
The existence of convection in the solid mantle is more surprising, but we now know that mantle rock below the lithosphere behaves as a ductile material; over long periods, it can flow like a very viscous fluid (see Earth Issues 14.1). As we saw in Chapters 1 and 2, seafloor spreading and plate movements are direct evidence of this solid-state convection at work. The hot mantle material that rises under mid-ocean ridges builds new lithosphere, which cools as it spreads away. In time, it sinks back into the mantle at subduction zones, where it is eventually resorbed and reheated. Through this process, heat is carried from Earth’s interior to its surface.
Temperatures Inside Earth
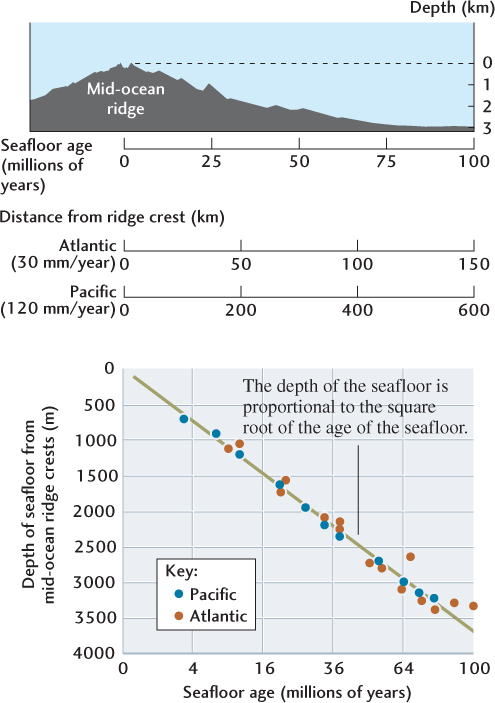
Geologists have many reasons for wanting to understand the geothermal gradient—the increase in temperature with depth—in Earth’s interior. Temperature and pressure determine the state of matter (solid or molten), its viscosity (resistance to flow), and how its atoms are packed together in crystals. A curve that describes the geothermal gradient in Earth’s interior is called a geotherm. In Figure 14.10, we compare one possible geotherm (in yellow) with the melting curves for mantle and core materials (in red). The melting curves show how the onset of melting depends on pressure, which increases with depth.
Geologists at Earth’s surface can directly measure temperatures at depths of up to 4 km in mines and more than 10 km in boreholes. They have found that the geothermal gradient is 208C to 308C per kilometer in most continental crust. Conditions below the crust can be inferred from the properties of lavas and rocks erupted by volcanoes. These data indicate that temperatures near the base of the lithosphere range from 13008C to 14008C. As Figure 14.10 shows, it is at these temperatures that the geotherm rises above the melting point of mantle rock. The geotherm intersects the melting curve at about 100 km beneath most oceanic crust, and somewhat deeper (150 to 200 km) beneath most continental crust. From this depth to where the geotherm drops below the melting curve, at depths of 200 to 250 km, mantle material is partially molten. These observations are consistent with the existence of a shear-wave low-velocity zone (see Figure 14.8), as well as with widespread evidence suggesting that basaltic magmas are produced by partial melting in the upper part of the asthenosphere.
The steep geothermal gradient near Earth’s surface tells us that heat is transported through the lithosphere by conduction. Below the lithosphere, the temperature does not rise as rapidly. If it did, temperatures in the deeper parts of the mantle would be so high (tens of thousands of degrees) that the lower mantle would be entirely molten, which is inconsistent with seismological observations. Instead, the change in temperature with depth drops to about 0.58C per kilometer, which is the geothermal gradient expected in a convecting mantle. This drop occurs because convection mixes cooler material near the top of the mantle with warmer material at greater depths, averaging out the temperature differences (just as temperatures are evened out when you stir your bathwater).
393
14.1 Glacial Rebound: Nature’s Experiment with Isostasy
If you depress a cork floating in water with your finger and then release it, the cork pops up almost instantly. A cork floating in molasses would rise more slowly because the drag of the viscous fluid would slow the process. How convenient it would be if we could push Earth’s crust down somewhere, remove the depressive force, and then sit back and watch the depressed area rise. From its response, we could learn much more about how isostasy works—in particular, about the viscosity of the mantle and how it affects rates of epeirogenic movement (uplift and subsidence).
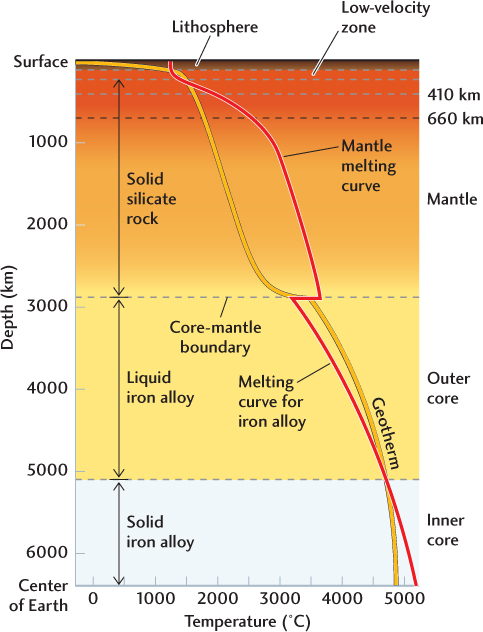
Nature has actually done this experiment for us. The depressive force is the weight of a continental glacier—an ice sheet 2 to 3 km thick. During the onset of an ice age, ice sheets can form in only a few thousand years. The immense ice load depresses the crust, and a downward bulge develops under the ice sheet, displacing enough mantle to provide buoyant support. Using the information in the Practicing Geology exercise and the densities of ice (0.92 g/cm3) and mantle material (3.3 g/cm3), we can calculate how much downwarping a 3-km ice sheet requires to achieve isostatic equilibrium:
(0.92 g/cm3 ÷ 3.3 g/cm3) × 3.0 km = 0.84 km
At the onset of a warming trend, the ice sheet melts rapidly. With the removal of its weight, the depressed crust begins to rebound, eventually rising back to its original level—in this case, 840 m higher than when it was under the full glacial load. Such glacial rebound has occurred in Norway, Sweden, Finland, Canada, and elsewhere in formerly glaciated regions. The most recent ice sheet retreated from those areas some 12,000 years ago, and the land has been rising ever since.
We can measure the rate of uplift by dating ancient beaches that were once at sea level and have since been uplifted. Figure 10.21 shows a series of raised beaches in northern Canada that have allowed geologists to measure the speed of glacial rebound, and thus to infer the viscosities of mantle materials. Those viscosities are very high. Even the asthenosphere—the weak layer where most of the mantle flow during glacial rebound takes place—is 10 orders of magnitude more viscous than silica glass is at mantle temperatures.
394
Phase changes—observed as steep increases in seismic wave velocities—occur in the transition zone at depths of 410 km and 660 km (see Figure 14.8). Seismology can accurately determine the depths (and thus the pressures) of these phase changes, so the temperatures at which the phase changes take place can be calibrated using high-pressure laboratory experiments. The values obtained from the laboratory data are consistent with the geotherm shown in Figure 14.10.
We have more limited information about the temperatures at greater depths. Most geologists agree that convection extends throughout the mantle, vertically mixing material and keeping the geothermal gradient low. Near the base of the mantle, however, we would expect temperatures to increase more rapidly, because the core-mantle boundary restricts vertical mixing. Convective movements near the core-mantle boundary, like those near the crust, are primarily horizontal rather than vertical. Close to the boundary, heat is transported from the core into the mantle mainly by conduction, and the geothermal gradient should therefore be high, as it is in the lithosphere.
Seismology tells us that the outer core is liquid, which means that its temperature is high enough to melt the iron alloy that constitutes it. Laboratory data indicate that this temperature is probably greater than 30008C, and that estimate is consistent with the high geothermal gradient at the base of the mantle predicted by convection models. The inner core, on the other hand, is solid. Because its iron-nickel composition is nearly the same as that of the outer core, the boundary between the inner core and outer core should correspond to the depth where the geotherm crosses the melting curve for the core material. This hypothesis implies that the temperature at Earth’s center is slightly less than 50008C.
Many aspects of this story can be debated, however, especially in regard to the deeper parts of the geotherm. For example, some geologists believe that the temperature at Earth’s center may be as high as 60008C to 70008C. More laboratory experiments and better calculations are required to reconcile these differences.