Visualizing Earth’s Three-Dimensional Structure
So far, we have investigated how the properties of Earth’s materials vary with depth. Such a one-dimensional description would suffice if our planet were a perfectly symmetrical sphere, but of course it is not. At the surface, we can see lateral variations (geographic differences) in Earth’s structure associated with oceans and continents and with the basic features of plate tectonics: mid-ocean ridges at spreading centers, deep-sea trenches at subduction zones, and mountain belts uplifted by continent-continent collisions.
Below the crust, we can expect that convection will cause variations in temperature from one part of the mantle to another. Downwelling currents, such as those associated with subducted lithospheric plates, will be relatively cold, whereas upwelling currents, such as those associated with mantle plumes, will be relatively hot. Computer models tell us that lateral variations in temperature due to mantle convection should be on the order of several hundred degrees. From laboratory experiments on rocks, we know that such temperature differences should cause small variations in seismic wave velocities from place to place. For example, a temperature increase of 1008C reduces the speed of an S wave traveling through mantle peridotite by about 1 percent (or even more if the rock is close to its melting temperature). If the mantle is indeed convecting, then seismic wave velocities should vary by several percentage points from place to place. Seismologists can make three--dimensional maps of these small lateral variations in wave velocities using the techniques of seismic tomography.
Seismic Tomography
Seismic tomography is an adaptation of a medical technique commonly used to map the human body, called computerized axial tomography (CAT). CAT scanners construct three-dimensional images of organs by measuring small differences in X rays that sweep the body in many directions. Similarly, we can use the travel times of seismic waves from earthquakes, as recorded on thousands of seismographs all over the world, to sweep Earth’s interior in many different directions and construct a three-dimensional image of what’s inside. A reasonable hypothesis, consistent with the results of laboratory experiments, is that regions where seismic waves speed up are composed of relatively cool, dense rock (for example, subducted plates), whereas regions where seismic waves slow down are composed of relatively hot, buoyant rock (for example, rising plumes).
Seismic tomography has revealed features in the mantle that are clearly associated with mantle convection. In the 1990s, researchers at Harvard University constructed a tomographic model of the mantle. Their model is displayed in Figure 14.11 as a cross section of Earth and as a series of global maps at depths ranging from just below the crust down to the core-mantle boundary. Near Earth’s surface (Figure 14.11b), you can clearly see the structures of plate tectonics. The upwelling of hot mantle material along the mid-ocean ridges is visible in warm colors; the cold lithosphere in old ocean basins and beneath the continental cratons is visible in cool colors.
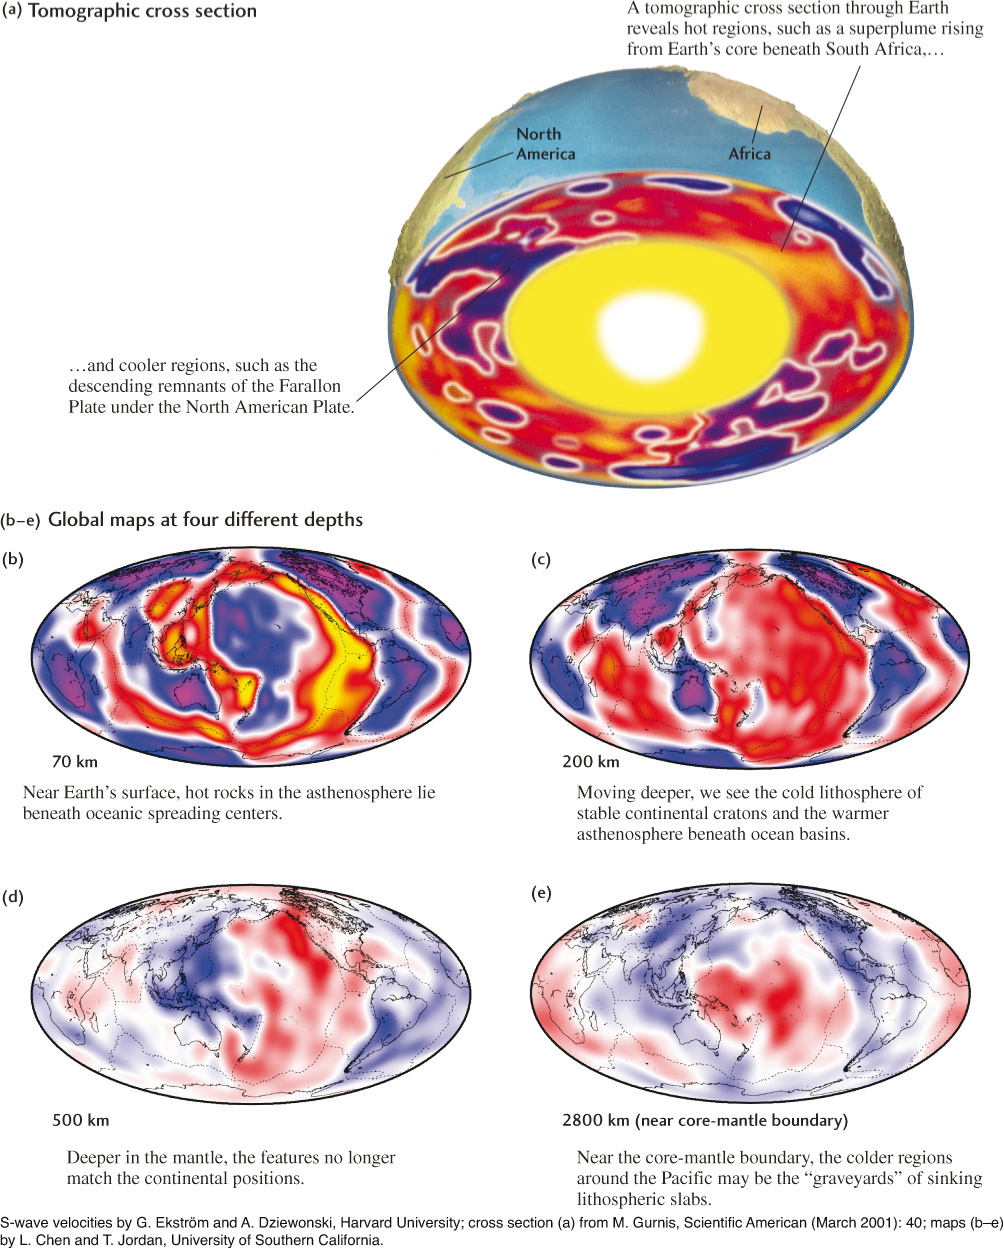
At greater depths, the features become more variable and less coherent with surface tectonic features, reflecting what is probably a complex pattern of mantle convection. Some large-scale features stand out particularly well. You will notice that just above the core-mantle boundary (Figure 14.11e), there is a red region of relatively low S-wave velocities beneath the central Pacific Ocean, surrounded by a broad blue ring of higher S-wave velocities. Seismologists have speculated that the high velocities represent a “graveyard” of cold oceanic lithosphere subducted beneath the Pacific’s volcanic island arcs and mountain belts—the Ring of Fire—during the last 100 million years or so.
395
396
The cross section through the mantle (Figure 14.11a) clearly reveals material from the once-large Farallon Plate, which has been almost completely subducted under North America (see Chapter 10). The obliquely sinking slab material (in blue) appears to have penetrated the entire mantle. The image also indicates sinking colder rock beneath Indonesia, another subduction zone. In addition, a large yellow blob of hotter rock, thought to be a “superplume,” can be seen rising at an angle from the core-mantle boundary to a position beneath southern Africa. This hot, buoyant mass pushing up the cooler material above it may explain the uplifted, mile-high plateaus of South Africa (see Figure 10.20e). The other visible blobs of hotter and cooler material may be evidence of material exchanges among the lithosphere, the mantle, and the layer of hotter material at the core-mantle boundary.
Earth’s Gravitational Field
The same temperature variations that speed up and slow down seismic waves also influence the densities of mantle rocks. Laboratory experiments have shown that the expansion of rock caused by a 3008C increase in temperature reduces its density by about 1 percent. This might seem to be a small effect, but the mass of Earth’s mantle is enormous (about 4 billion trillion tons!), so even small changes in the distribution of its mass can lead to observable variations in the pull of Earth’s gravity.
Geologists can determine features of Earth’s mass distribution by observing variations in the gravitational field above its surface, as well as from bulges and dimples in the shape of the planet. They have been able to show that the shape measured by Earth-orbiting satellites matches the pattern of mantle convection imaged by seismic tomography (see Earth Issues 14.2). This agreement has allowed us to refine our models of the mantle convection system.