Practicing Geology Exercise
What Happened in Baja? How Geologists Reconstruct Plate Movements
Geographers and geologists have long puzzled over the unusual geography of Baja California. Why is the Gulf of California so long and thin? Why is the Baja California peninsula parallel to the Mexican coastline?
When the Spanish conquistador Hernando Cortés landed on the shores of California in 1535, he thought he had discovered an island. Decades passed before the Spanish realized that the northern half of Isla California was actually the west coast of North America, and that its lower half, Baja California, was a long, thin peninsula, separated from the continent by the narrow Gulf of California.
Four centuries later, plate tectonic theory provided a neat geologic answer to the Baja puzzle. To the north, in Alta California (a.k.a. the Golden State), the Pacific Plate is moving past the North American Plate along the San Andreas transform fault. To the south, the divergent boundary between the Pacific Plate and the small Rivera Plate forms part of the East Pacific Rise, a mid-ocean ridge that produces new oceanic crust as the two plates spread apart.
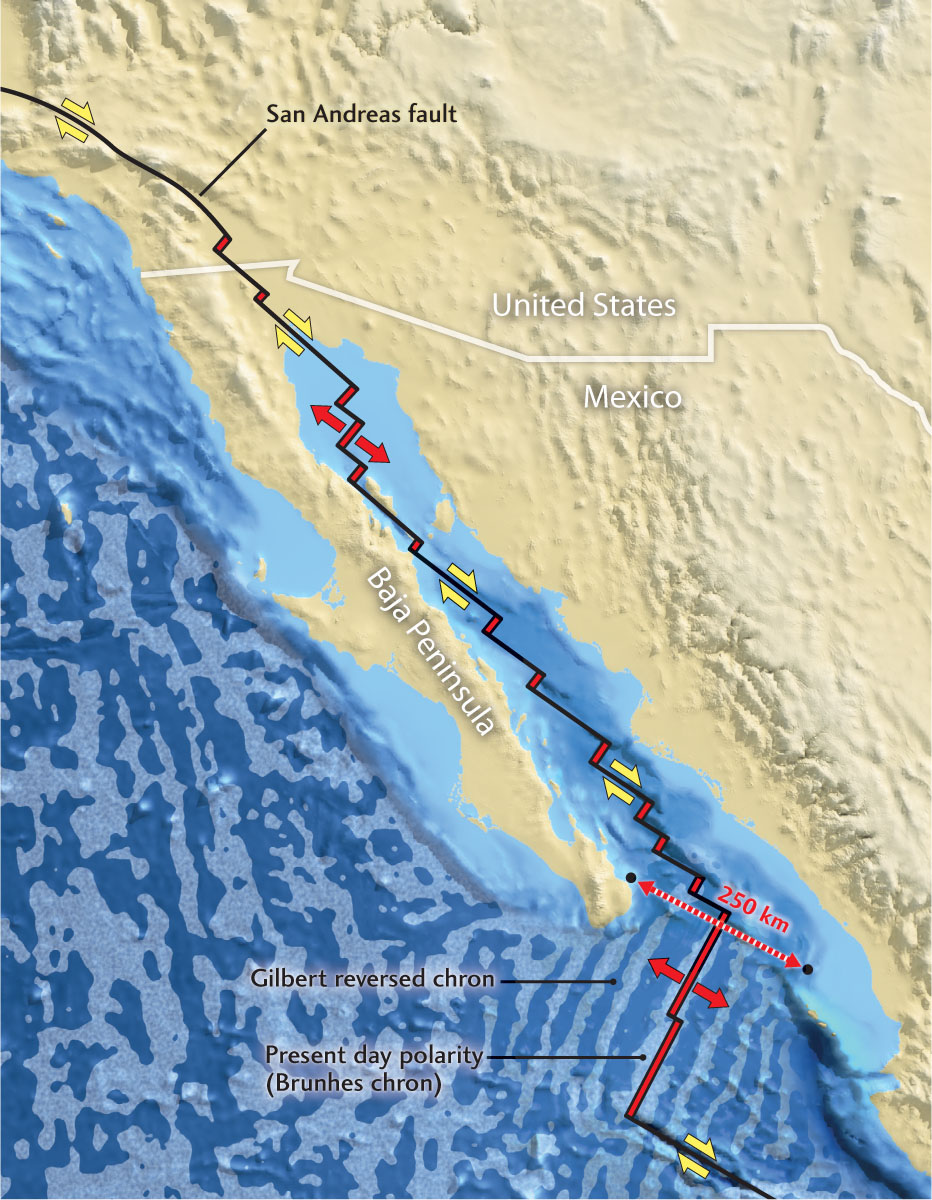
By mapping earthquake locations and undersea volcanoes, marine geologists were able to show that the San Andreas fault is connected to the East Pacific Rise by a dozen small spreading centers offset by transform faults—a plate boundary that steps like stairs up the entire length of the Gulf of California. The relative movement of the Pacific and North American plates is thus shifting Baja California away from the mainland in a northwesterly direction, parallel to the transform faults, and the Gulf of California is being progressively widened by seafloor spreading.
54
How fast is this happening? An estimate can be made by using the equation
speed = distance ÷ time
We need two types of data to apply this equation:
 We can measure the distance by which Baja California has separated from Mexico directly from a seafloor map: about 250 km.
-
We can estimate the time since the separation began from the pattern of magnetic anomalies across the East Pacific Rise. On both sides of that spreading center, the magnetic anomaly closest to the continental margin (and therefore the oldest) is the Gilbert reversed chron. Using the magnetic time scale in Figure 2.12c, we obtain a separation age of about 5 million years (My).
With this information, we can calculate the approximate speed of seafloor spreading in the Gulf of California:
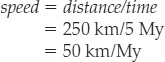
or 50 mm/year.
Of course, this is only an average speed. How steady has it been? The plate separation could have started slowly and gradually picked up speed, or started fast and then slowed down. If the former is true, then the present-day separation rate should be greater than the average rate; if the latter, it should be less.
Using GPS, geologists were able to test these hypotheses using a totally different type of measurement. In the decade from 1990 to 2000, they repeatedly surveyed the locations of points on both sides of the Gulf of California oriented parallel to the plate movements. They found that the distances between these points increased by half a meter; that is, by 500 millimeters in 10 years, or 50 mm/year. Thus, the present-day speed of movement is approximately the same as the average speed; no speedup or slowdown of plate movements is necessary to account for it.
Based on the agreement between these two measurements as well as other data, geologists came up with a simple story. Before 5 million years ago, when Baja California was part of the mainland, the boundary between the Pacific and North American plates lay somewhere west of the North American continent. About 5 million years ago, this boundary jumped inland, initiating seafloor spreading in the Gulf of California. The plate movement has been nearly steady at 50 mm/year ever since.
This theory has survived various tests. For example, it predicts that the current slipping along the San Andreas fault should also have begun about 5 million years ago, and that prediction agrees with the ages of rocks that have been displaced by the modern San Andreas fault.
The puzzle of Baja is no mere curiosity. As we will see in later chapters, the plate tectonic stories we learn through calculations like these help geologists calibrate earthquake hazards and search for mineral resources.
BONUS PROBLEM: Use a globe and the isochron map in Figure 2.15 to estimate the average speed of continental drift between North America and Africa. How well does this speed compare with the present-day value of 23 mm/year determined using GPS? [See this chapter’s Google Earth Project, exercise 3.]