Mapping Geologic Structure
Faults and folds are examples of the basic features geologists observe and map to reconstruct crustal deformation. To better understand this process, we need information about the geometry of faults and folds. The best place to find this information is at an outcrop, where the solid rock that underlies the ground surface—the bedrock—is exposed (not obscured by vegetation, soil, or loose boulders). At an outcrop, geologists can identify distinct formations: groups of rock layers that can be identified throughout a region by their physical properties. Some formations consist of a single rock type, such as limestone. Others are made up of thin, interlayered beds of different kinds of rock, such as sandstone and shale. However they vary, each formation comprises a distinct set of rock layers that can be recognized and mapped as a unit.
173
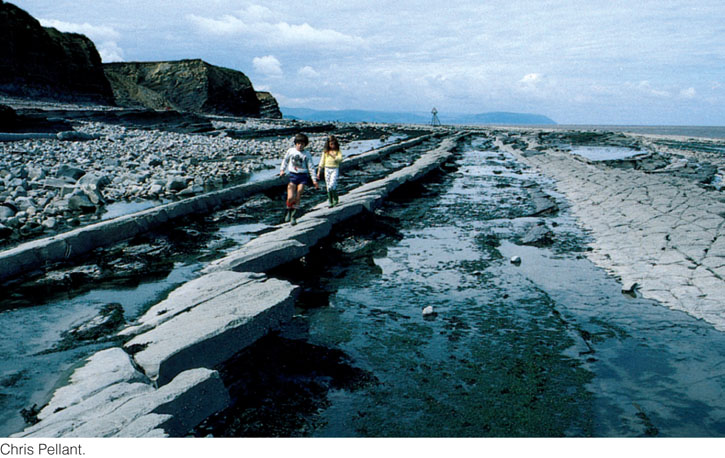
Figure 7.1a shows an outcrop in which the folding of sedimentary beds is clearly visible. Often, however, folded rocks are only partly exposed in an outcrop and can be seen only as inclined layers (Figure 7.2). The orientation of those layers is an important clue we can use to piece together a picture of the overall geologic structure. Two measurements describe the orientation of a rock layer exposed at an outcrop: the strike and the dip of the layer’s surface.
Measuring Strike and Dip
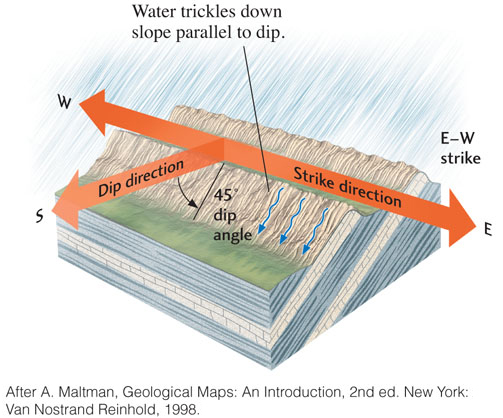
The strike is the compass direction of a rock layer where it intersects with a horizontal surface. The dip, which is measured at right angles to the strike, is simply the amount of tilting—the angle at which the rock layer inclines from the horizontal. Figure 7.3 shows how strike and dip are measured in the field. A geologist might describe the outcrop in this figure as “a bed of coarse-grained sandstone striking east-west and dipping 45° south.”
Geologic Maps
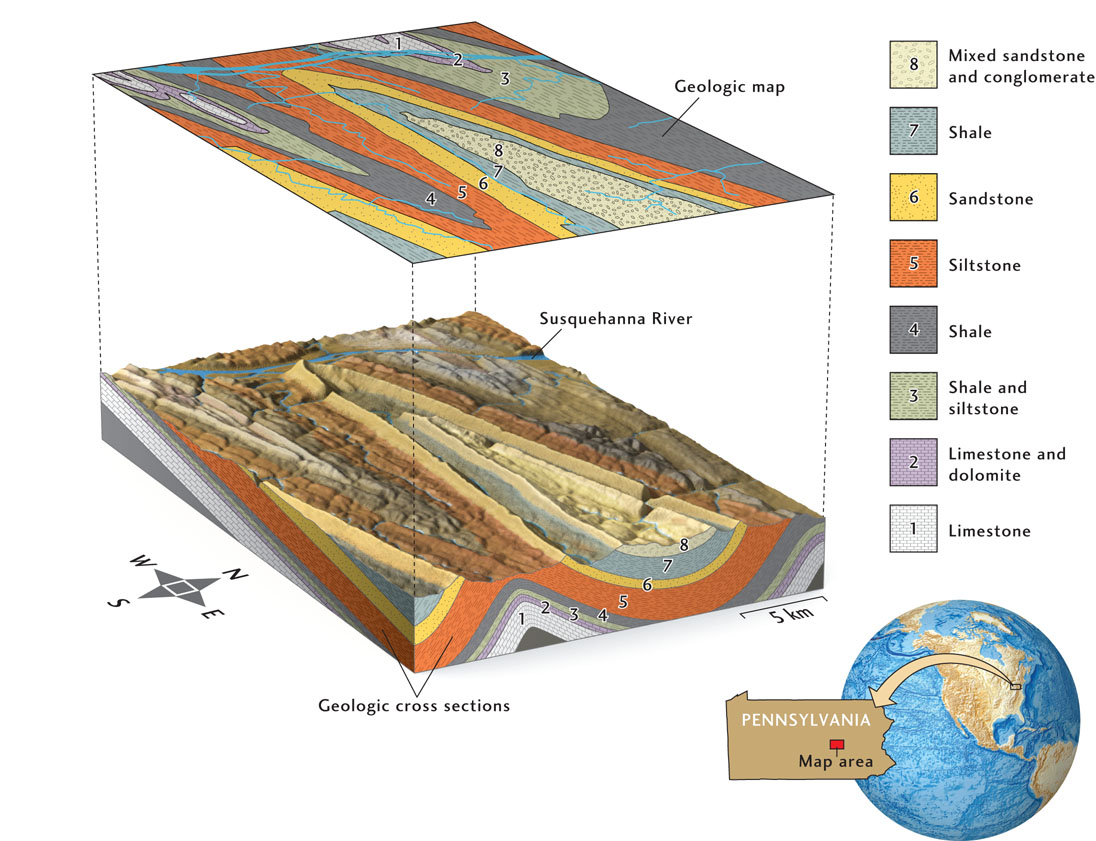
Geologic maps are two-dimensional representations of the rock formations exposed at Earth’s surface (Figure 7.4). To create a geologic map, a geologist must choose an appropriate scale—the ratio of distance on the map to true surface distance. A common scale for geologic field mapping is 1:24,000 (pronounced “one to twenty-four thousand”), which means that 1 inch on the map corresponds to 24,000 inches (2000 feet) on Earth’s surface. To depict the geology of an entire state, a geologist would choose a smaller scale: say, 1:1,000,000, where 1 cm represents 10 km and 1 inch almost 16 miles. The smaller the scale, the less detail can be depicted on the map.
174
Geologists keep track of different rock formations by assigning each formation a particular color on the map, usually keyed to the rock’s type and age (see Figure 7.4). Many different rock formations may be exposed in highly deformed regions, so geologic maps can be very colorful!
Softer rocks, such as mudstones and other poorly consolidated sediments, are more easily eroded than harder rocks, such as limestones, sandstones, or metamorphic rocks. Consequently, rock types can exert a strong influence on the topography of the land surface and the exposure of rock formations (see Figure 7.4). The important relationships between geology and topography can be made clear by plotting the contours of the land surface on a geologic map.
Because geologic maps can represent such a huge amount of information, they have been called “textbooks on a piece of paper.” To convey this information more concisely, geologic maps are annotated with special symbols that indicate the local strike and dip of rock formations and with special types of lines that mark faults and other significant features. For instance, the strike and dip of rock formations are indicated on a geologic map by T-like symbols:
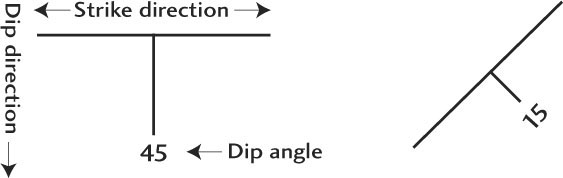
The top of the T indicates the strike direction, the shank of the T indicates the dip direction, and the number gives the dip angle in degrees. On a map where north is up, the symbol on the left thus describes the sandstone bed in Figure 7.3, which has an east-west strike and a dip of 45° to the south. The one on the right describes a formation that strikes northeast-southwest and dips to the southeast at an angle of 15°, such as the beds in Figure 7.2.
Of course, not every detail of surface geology can be represented on a map, so geologists must simplify the structures they see, perhaps by representing a complex zone of faulting as a single fault or by ignoring folds too small to show at the scale they have chosen. They may also “dust off” their maps by ignoring thin layers of soil and loose rock that cover up the geologic structure, portraying the structure as if outcrops existed everywhere. You should therefore think of a geologic map as a simplified scientific model of the surface geology.
175
Geologic Cross Sections
Once a region has been mapped, the two-dimensional geologic map must be interpreted in terms of the underlying three-dimensional geologic structure. How can the shapes of the rock layers be reconstructed, even when erosion has removed parts of a formation? The process is like putting together a three-dimensional jigsaw puzzle with some of the pieces missing. Common sense and intuition play important roles, as do basic geologic principles.
To piece together the puzzle, geologists construct geologic cross sections—diagrams showing the features that would be visible if vertical slices were made through part of the crust. Some small cross sections can actually be seen in the vertical faces of cliffs, quarries, and road cuts (Figure 7.5). Cross sections spanning much larger areas can be constructed from the information on a geologic map, including the strikes and dips observed at outcrops. The accuracy of cross sections based on surface mapping can be improved by drilling boreholes to collect rock samples as well as by seismic imaging. But drilling and seismic imaging are expensive, so data collected by these methods are usually available only for areas that have been explored for oil, water, or other valuable natural resources.
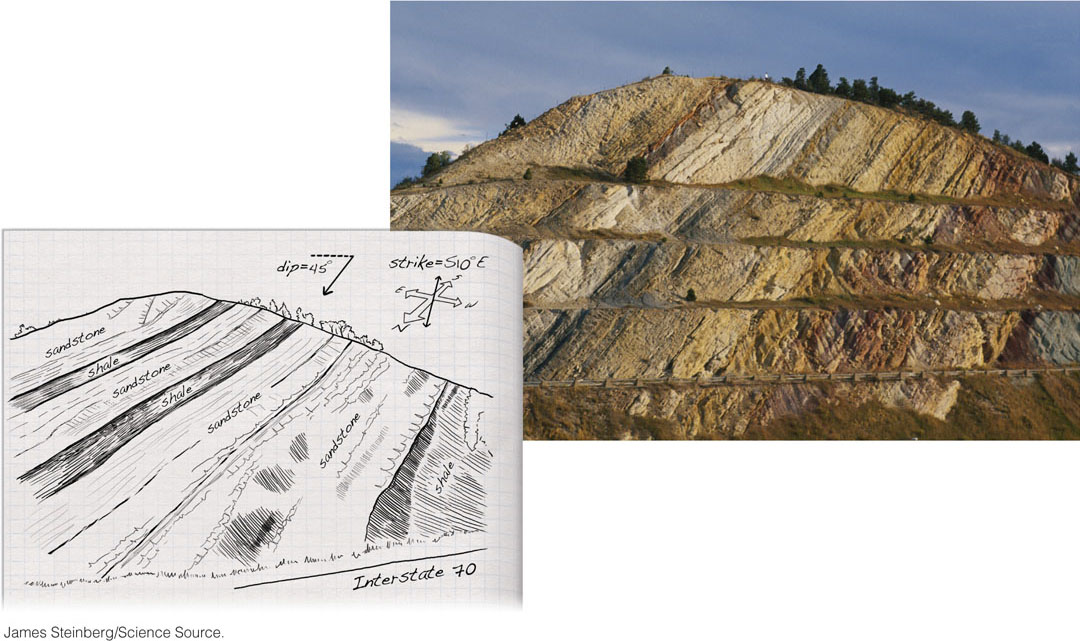
Figure 7.4 shows a geologic map of an area where originally horizontal beds of sedimentary rock were bent into a series of folds and eroded into a set of zigzagging ridges and valleys. We will explore some of the geologic relationships seen in this map later in this chapter. But first we will investigate the basic processes by which rocks deform.