16-6 Spikes of rising gas extend through the Sun’s chromosphere
An ordinary visible-light image such as Figure 16-7 gives the impression that the Sun ends at the top of the photosphere. But during a total solar eclipse, the Moon blocks the photosphere from our view, revealing a glowing, pinkish layer of gas above the photosphere (Figure 16-11). This layer is the tenuous chromosphere (“sphere of color”), the second of the three major levels in the Sun’s atmosphere. The chromosphere is only about one ten-thousandth (10−4) as dense as the photosphere, or about 10−8 as dense as our own atmosphere. No wonder it is normally invisible!
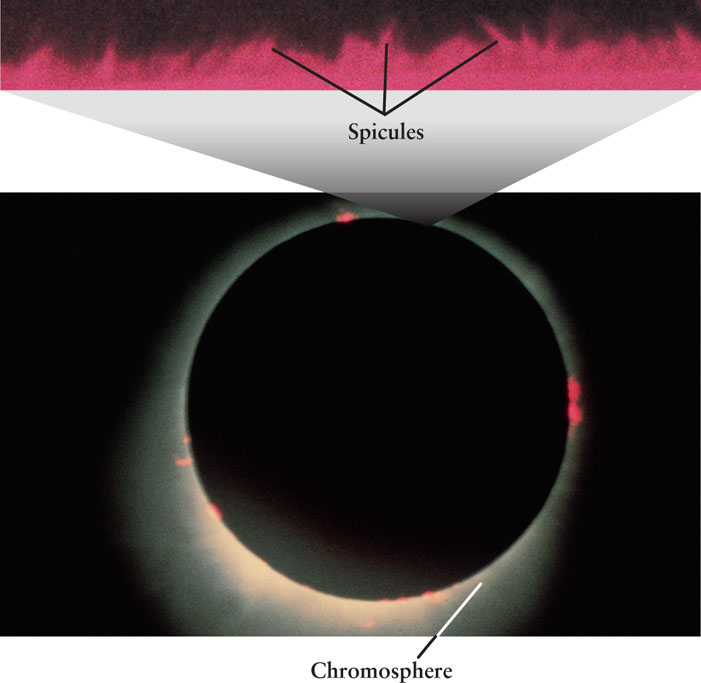
The Chromosphere During a total solar eclipse, the Sun’s glowing chromosphere can be seen around the edge of the Moon. It appears pinkish because its hot gases emit light at only certain discrete wavelengths, principally the Hα emission of hydrogen at a red wavelength of 656.3 nm. The expanded area above shows spicules, jets of chromospheric gas that surge upward into the Sun’s outer atmosphere.
Comparing the Chromosphere and Photosphere
Unlike the photosphere, which has an absorption line spectrum, the chromosphere has a spectrum dominated by emission lines. An emission line spectrum is produced by the atoms of a hot, thin gas (see Section 5-6 and Section 5-8). As their electrons fall from higher to lower energy levels, the atoms emit photons.
One of the strongest emission lines in the chromosphere’s spectrum is the Hα line at 656.3 nm, which is emitted by a hydrogen atom when its single electron falls from the n = 3 level to the n = 2 level (recall Figure 5-23b). This wavelength is in the red part of the spectrum, which gives the chromosphere its characteristic pinkish color. The spectrum also contains emission lines of singly ionized calcium, as well as lines due to ionized helium and ionized metals. In fact, helium—named after Helios, a Greek reference to the Sun—was originally discovered through detection in the chromospheric spectrum in 1868, almost 30 years before helium was discovered on Earth.
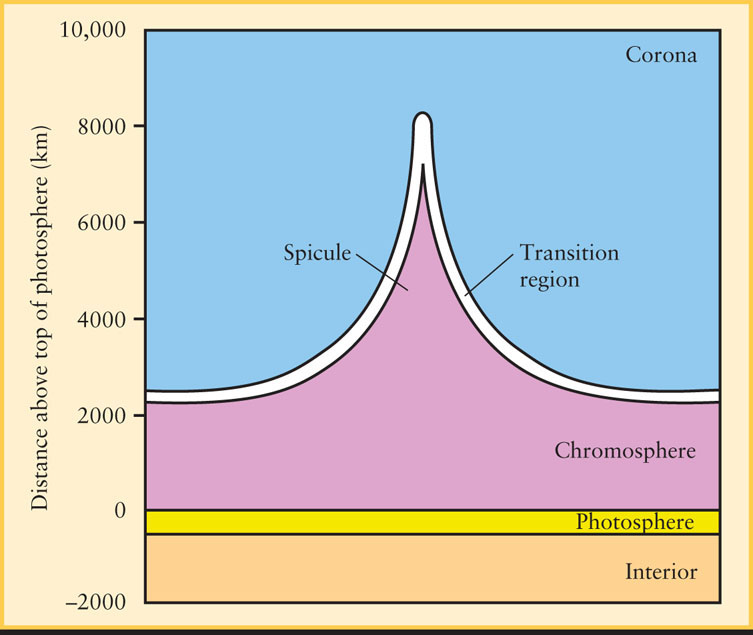
Analysis of the chromospheric spectrum shows that temperature increases with increasing height in the chromosphere. This trend is just the opposite of the situation in the photosphere, where temperature decreases with increasing height. The temperature is about 4400 K at the top of the photosphere; 2000 km higher, at the top of the chromosphere, the temperature is nearly 25,000 K. This temperature difference is very surprising, since temperatures should decrease as you move away from the Sun’s interior. In Section 16-10 we will see how solar scientists explain this seeming paradox.
The photosphere’s spectrum is dominated by absorption lines at certain wavelengths, while the spectrum of the chromosphere has emission lines at these same wavelengths. In other words, the photosphere appears dark at the specific wavelengths at which the chromosphere emits most strongly, such as the Hα wavelength of 656.3 nm. By viewing the Sun through a special filter that is transparent to light only at the wavelength of Hα, astronomers can screen out light from the photosphere and make the chromosphere visible. Filters make it possible to see the chromosphere at any time, not just during a solar eclipse.
Spicules
Jets of gas thousands of kilometers in height rise through the chromosphere
The top photograph in Figure 16-11 is a high-resolution image of the Sun’s chromosphere taken through an Hα filter. This image shows numerous vertical spikes, which are actually jets of rising gas called spicules. A typical spicule lasts just 15 minutes or so: It rises at the rate of about 20 km/s (72,000 km/h, or 45,000 mi/h), can reach a height of several thousand kilometers, and then collapses and fades away (Figure 16-12). Approximately 300,000 spicules exist at any one time, covering about 1% of the Sun’s surface. When viewed from above, spicules can surround a sunspot, as in Figure 16-13 (we will learn more about sunspots in Section 16-8). While the Sun’s magnetic field appears to be involved in the production of spicules, the details are not understood.
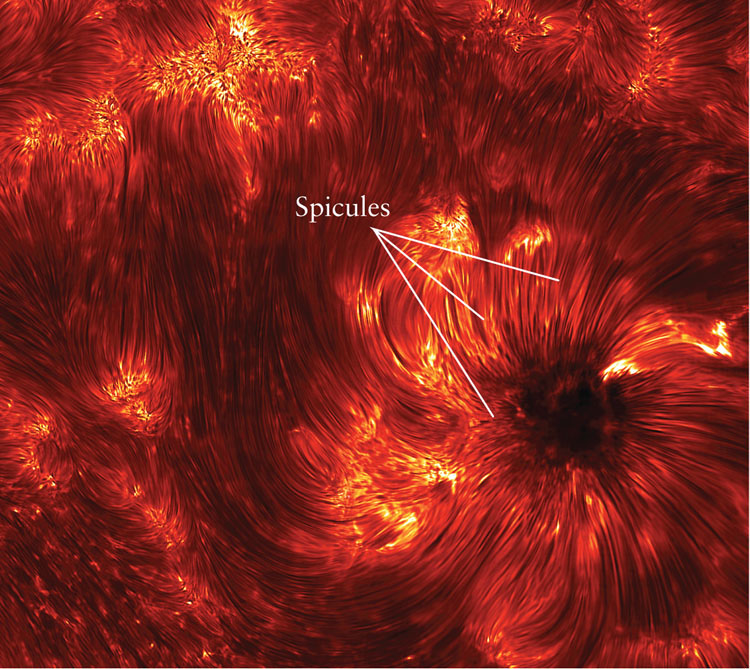
Spicules from Above Surrounding this sunspot are numerous spicules, also called “fibrils” because of their long and thin fiberlike shape. These spicules are about as long as Earth’s diameter and contain very hot gas confined by magnetic fields. This is one of the highest-resolution images of the Sun ever made.
CONCEPT CHECK 16-12
Why do the spicules in Figure 16-11 appear red? Do spicules emit light at other wavelengths?
Figure 16-11 is taken with an Hα filter that only allows red light to pass through and form the image. This method is used to block out the Sun’s other light that would overwhelm the camera. Since the Hα line is red (at 656.3 nm), the spicules appear red, but they emit other wavelengths as well.