17-10 Spectroscopy makes it possible to study binary systems in which the two stars are close together
We have described how the masses of stars can be determined from observations of visual binaries, in which the two stars can be distinguished from each other. But if the two stars in a binary system are too close together, the images of the two stars can blend to produce the semblance of a single star. Happily, in many cases we can use spectroscopy to decide whether a seemingly single star is in fact a binary system. Spectroscopic observations of binaries provide additional useful information about star masses.
Some binaries are discovered when the spectrum of a star shows incongruous spectral lines. For example, the spectrum of what appears to be a single star may include both strong hydrogen lines (characteristic of a type A star) and strong absorption bands of titanium oxide (typical of a type M star). Because a single star cannot have the differing physical properties of these two spectral types, such a star must actually be a binary system that is too far away for us to resolve its individual stars. A binary system detected in this way is called a spectrum binary.
Other binary systems can be detected using the Doppler effect. If a star is moving toward Earth, its spectral lines are displaced toward the short-wavelength (blue) end of the spectrum. Conversely, the spectral lines of a star moving away from us are shifted toward the long-wavelength (red) end of the spectrum. The upper portion of Figure 17-23 applies these ideas to a hypothetical binary star system with an orbital plane that is edge-on to our line of sight.
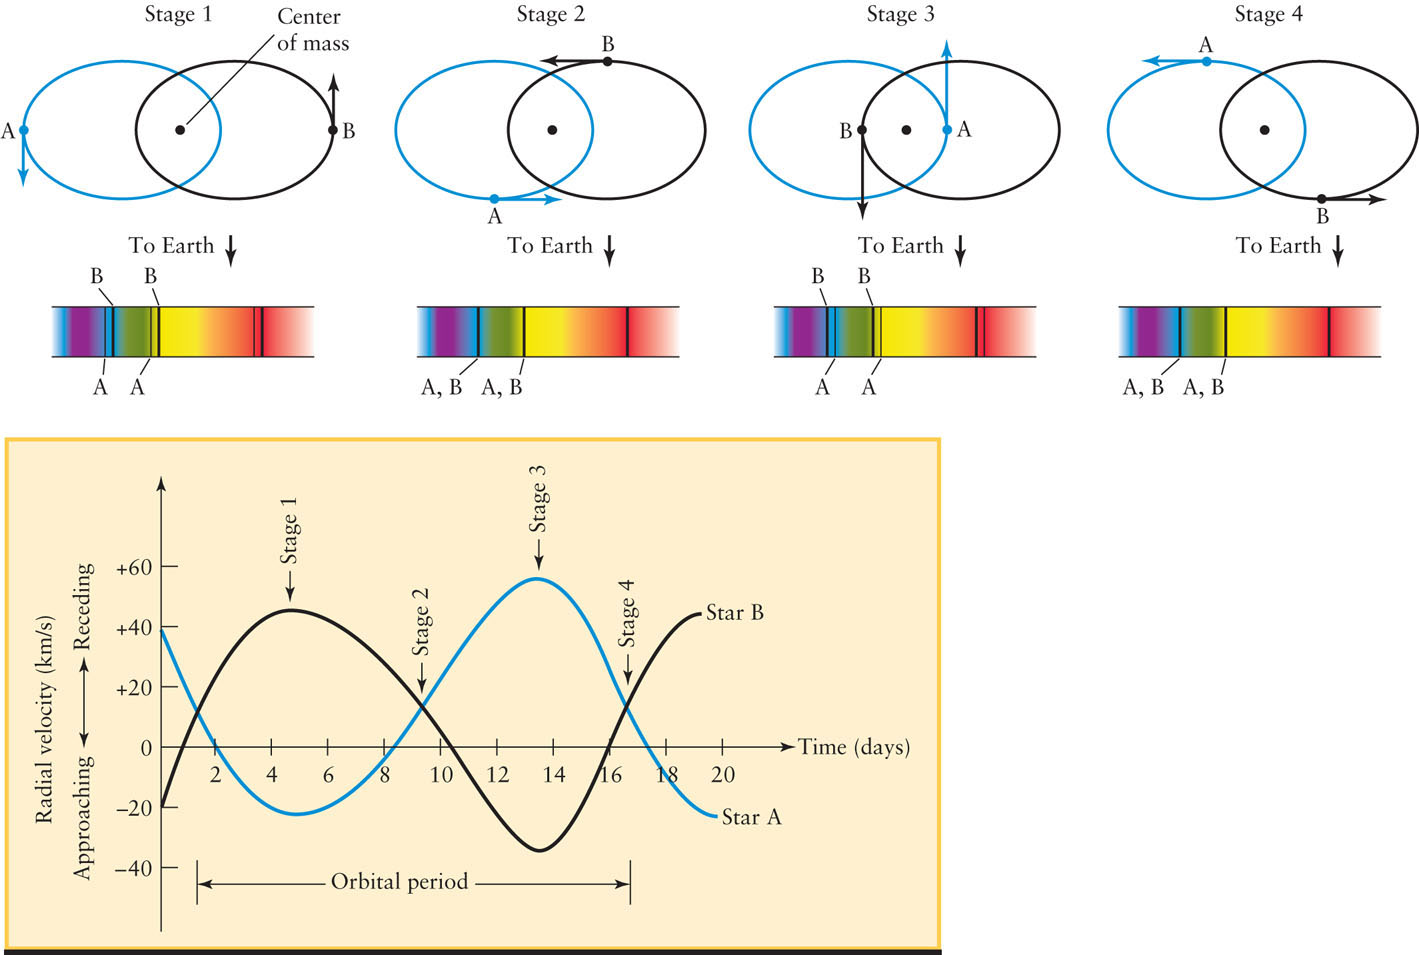
 Radial Velocity Curves The lower graph displays the radial velocity curves of the binary system HD 171978. The drawings at the top indicate the positions of the stars (labeled A and B) and the same absorption line from each star in the binary at four selected moments (stages 1, 2, 3, and 4) during an orbital period. Note that at stages 1 and 3, the Doppler effect splits apart the absorption lines from stars A and B. The approaching star is blueshifted and the receding star is redshifted. In stages 2 and 4, the lines are not split because neither star moves toward us or away from us any more than the other star. The entire binary star system is moving away from us at 12 km/s, which is why the entire pattern of radial velocity curves is displaced upward from the zero-velocity line.
As the two stars move around their orbits, they periodically approach and recede from us. Hence, the spectral lines of the two stars are alternately blueshifted and redshifted. The two stars in this hypothetical system are so close together that they appear through a telescope as a single star with a single spectrum. Because one star shows a blueshift while the other is showing a redshift, the spectral lines of the binary system appear to split apart and rejoin periodically. Stars whose binary character is revealed by such shifting spectral lines are called spectroscopic binaries.
Exploring Spectroscopic Binary Stars
Stars in close binary systems move so rapidly that we can detect their motion using the Doppler effect
To analyze a spectroscopic binary, astronomers measure the wavelength shift of each star’s spectral lines and use the Doppler shift formula (introduced in Section 5-9 and Box 5-6) to determine the radial velocity of each star—that is, how fast and in what direction it is moving along our line of sight. The lower portion of Figure 17-22 shows a graph of the radial velocity versus time, called a radial velocity curve, for the binary system HD 171978. Each of the two stars alternately approaches and recedes as it orbits around the center of mass. The pattern of the curves repeats every 15 days, which is the orbital period of the binary.
It is important to emphasize that the Doppler effect applies only to motion along the line of sight. Motion perpendicular to the line of sight does not affect the observed wavelengths of spectral lines. Hence, the ideal orientation for a spectroscopic binary is to have the stars orbit in a plane that is edge-on to our line of sight. (By contrast, a visual binary is best observed if the orbital plane is face-on to our line of sight.) For the Doppler shifts to be noticeable, the orbital speeds of the two stars should be at least a few kilometers per second.
As for visual binaries, spectroscopic binaries allow astronomers to learn about stellar masses. From a radial velocity curve, one can find the ratio of the masses of the two stars in a binary. The sum of the masses is related to the orbital speeds of the two stars by Kepler’s laws and Newtonian mechanics. If both the ratio of the masses and their sum are known, the individual masses can be determined using algebra. However, determining the sum of the masses requires that we know how the binary orbits are tilted from our line of sight. This is because the Doppler shifts reveal only the radial velocities of the stars rather than their true orbital speeds. This tilt is often impossible to determine, because we cannot see the individual stars in the binary. Thus, the masses of stars in spectroscopic binaries tend to be uncertain.
There is one important case in which we can determine the orbital tilt of a spectroscopic binary. If the two stars are observed to eclipse each other periodically, then we must be viewing the orbit nearly edge-on. As we will see next, individual stellar masses—as well as other useful data—can be determined if a spectroscopic binary also happens to be such an eclipsing binary.
CONCEPT CHECK 17-20
In Figure 17-23, describe the Doppler shift observed at Stage 2 of the binary orbit.
At Stage 2, neither of the stars moves toward or away from Earth. The only radial velocity Doppler shift arises from the pair of stars as they drift together through space, which in this case, can be read near the bottom of Figure 17-23 for Stage 2 at about +12 km/s away from Earth. Since both stars have this same radial velocity at Stage 2, their absorption lines are not split.