7-3 Spectroscopy reveals the chemical composition of the planets
The light we receive from a planet or satellite is reflected sunlight—but with revealing differences in its spectrum
As we have seen, the average densities of the planets and satellites give us a crude measure of their chemical compositions—that is, what substances they are made of. For example, the low average density of the Moon (3340 kg/m3) compared with Earth (5515 kg/m3) tells us that the Moon contains relatively little iron or other dense metals. But to truly understand the nature of the planets and satellites, we need to know their chemical compositions in much greater detail than we can learn from average density alone.
The most accurate way to determine chemical composition is by directly analyzing samples taken from a planet’s atmosphere and soil. Unfortunately, of all the planets and satellites, we have such direct information only for Earth and the four worlds on which spacecraft have landed—Venus, the Moon, Mars, and Titan. In all other cases, astronomers must analyze sunlight reflected from the distant planets and their satellites. To do that, astronomers bring to bear one of their most powerful tools, spectroscopy, the systematic study of spectra and spectral lines. (We discussed spectroscopy in Section 5-6 and Section 6-5.)
Determining Atmospheric Composition
Spectroscopy is a sensitive probe of the composition of a planet’s atmosphere. If a planet has an atmosphere, then sunlight reflected from that planet must have passed through its atmosphere before coming back out. During this passage, some of the wavelengths of sunlight will have been absorbed. Hence, the spectrum of this reflected sunlight will have dark absorption lines. Astronomers look at the particular wavelengths absorbed and the amount of light absorbed at those wavelengths. Both of these depend on the kinds of chemicals present in the planet’s atmosphere and the abundance of those chemicals.
For example, astronomers have used spectroscopy to analyze the atmosphere of Saturn’s largest satellite, Titan (see Figure 7-3a and Table 7-2). The graph in Figure 7-3b shows the spectrum of visible sunlight reflected from Titan. (We first saw this method of displaying spectra in Figure 6-21.) The dips in this curve of intensity versus wavelength represent absorption lines. However, not all of these absorption lines are produced in the atmosphere of Titan (Figure 7-3c). Before reaching Titan, light from the Sun’s glowing surface must pass through the Sun’s own hydrogen-rich atmosphere. This produces the hydrogen absorption line in Figure 7-3b at a wavelength of 656 nm. After being reflected from Titan, the light must pass through Earth’s atmosphere before reaching the observing telescope; this is where the oxygen absorption line in Figure 7-3b is produced. Only the two dips near 620 nm and 730 nm are caused by gases in Titan’s atmosphere.
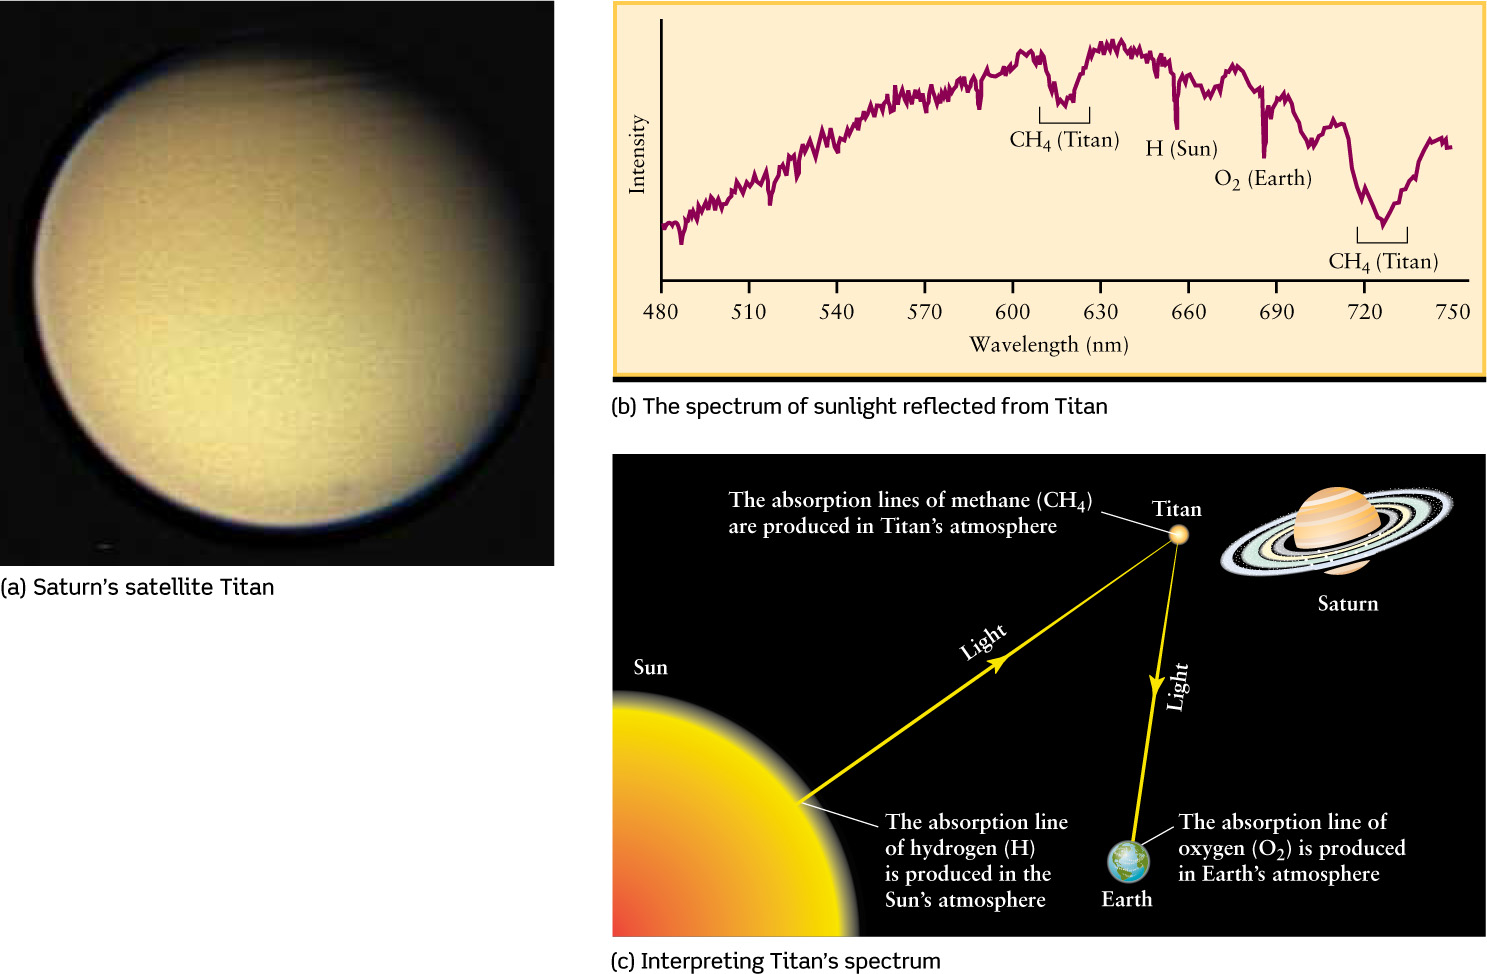
Analyzing a Satellite’s Atmosphere through Its Spectrum (a) Titan is the only satellite in the solar system with a substantial atmosphere. (b) The dips in the spectrum of sunlight reflected from Titan are due to absorption by hydrogen atoms (H), oxygen molecules (O2), and methane molecules (CH4). Of these, only methane is actually present in Titan’s atmosphere. (c) This illustration shows the path of the light that reaches us from Titan. To interpret the spectrum of this light as shown in (b), astronomers must account for the absorption that takes place in the atmospheres of the Sun and Earth.
These two absorption lines are caused not by individual atoms in the atmosphere of Titan but by atoms combined to form molecules. (We introduced the idea of molecules in Section 5-6.) Molecules, like atoms, also produce unique patterns of lines in the spectra of astronomical objects. The absorption lines in Figure 7-3b indicate the presence in Titan’s atmosphere of methane molecules (CH4, a molecule made of one carbon atom and four hydrogen atoms). Titan must be a curious place indeed, because on Earth, methane is a rather rare substance that is the primary ingredient in natural gas! When we examine other planets and satellites with atmospheres, we find that all of their spectra have absorption lines of molecules of various types.
In addition to visible-light measurements such as those shown in Figure 7-3b, it is very useful to study the infrared and ultraviolet spectra of planetary atmospheres. Many molecules have much stronger spectral lines in these nonvisible wavelength bands than in the visible. As an example, the ultraviolet spectrum of Titan shows that nitrogen molecules (N2) are the dominant constituent of Titan’s atmosphere. Furthermore, Titan’s infrared spectrum includes spectral lines of a variety of molecules that contain carbon and hydrogen, indicating that Titan’s atmosphere has a very complex chemistry. None of these molecules could have been detected by visible light alone. Because Earth’s atmosphere is largely opaque to infrared and ultraviolet wavelengths (see Section 6-7), telescopes in space are important tools for these spectroscopic studies of the solar system.
It is a testament to the power of spectroscopy that when the robotic spacecraft Huygens landed on Titan in 2005, its onboard instruments confirmed the presence of methane and nitrogen in Titan’s atmosphere—just as had been predicted years before by spectroscopic observations.
CONCEPT CHECK 7-5
If planets reflect some of the Sun’s light rather than emitting visible light of their own, how can spectroscopy reveal information about a planet’s atmosphere?
As sunlight passes through a planet’s atmosphere (just before and after reflection off of the planet’s surface), the atoms and molecules in the atmosphere absorb specific wavelengths of light unique to these atoms and molecules. By looking at this absorption spectrum in the reflected sunlight, astronomers can infer the composition of the atmosphere as illustrated in Figure 7-3.
Determining Surface Composition
Spectroscopy can also provide useful information about the solid surfaces of planets and satellites without atmospheres. When light shines on a solid surface, some wavelengths are absorbed while others are reflected. (For example, a plant leaf absorbs red and violet light but reflects green light—which is why leaves look green.) Unlike a gas, a solid illuminated by sunlight does not produce sharp, definite spectral lines. Instead, only broad absorption features appear in the spectrum. By comparing such a spectrum with the spectra of samples of different substances on Earth, astronomers can infer the chemical composition of the surface of a planet or satellite.
As an example, Figure 7-4a shows Jupiter’s satellite Europa (see Table 7-2), and Figure 7-4b shows the infrared spectrum of light reflected from the surface of Europa. Because this spectrum is so close to that of water ice—that is, frozen water—astronomers conclude that water ice is the dominant constituent of Europa’s surface. (We saw in Section 7-2 that water ice cannot be the dominant constituent of Europa’s interior, because this satellite’s density is too high.)
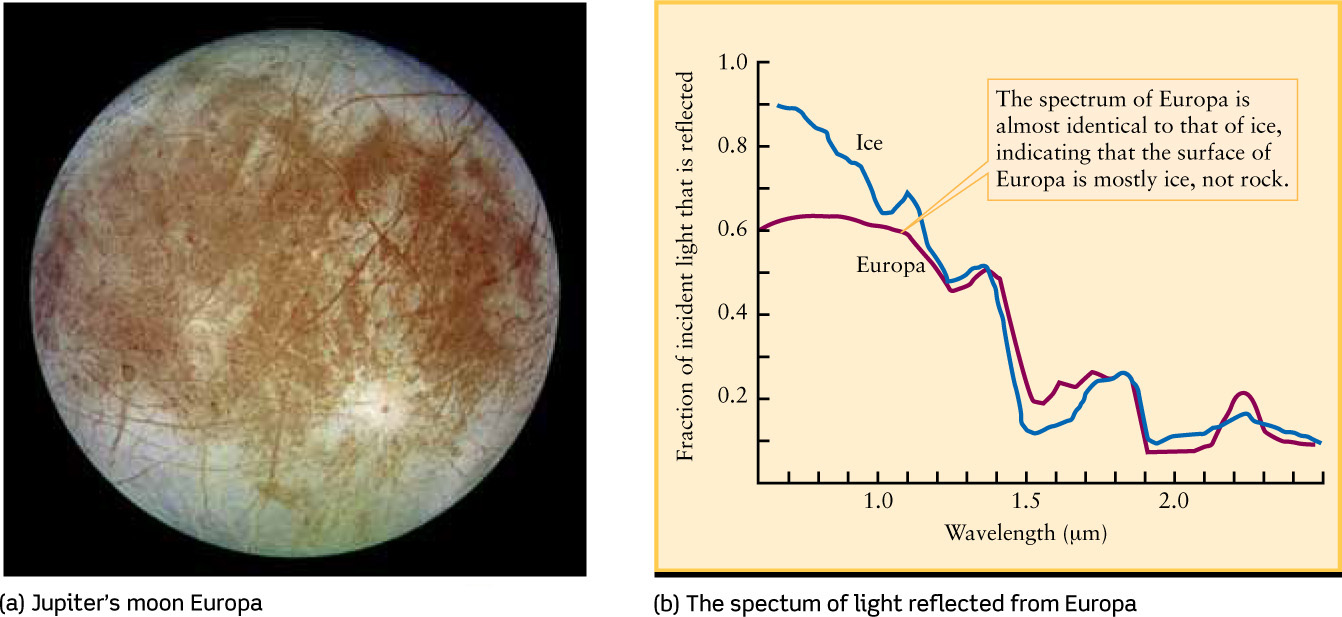
Analyzing a Satellite’s Surface from Its Spectrum (a) Unlike Titan (Figure 7-3a), Jupiter’s satellite Europa has no atmosphere. (b) Infrared light from the Sun that is reflected from the surface of Europa has nearly the same spectrum as sunlight reflected from ordinary water ice.
Unfortunately, spectroscopy tells us little about what the material is like just below the surface of a satellite or planet. For this purpose, there is simply no substitute for sending a spacecraft to a planet and examining its surface directly.
CONCEPT CHECK 7-6
How is the spectrum of reflected sunlight from a solid planetary surface different from the spectrum produced when sunlight passes through a planet’s gaseous atmosphere?
The reflected spectrum from a solid surface shows broad absorption features, whereas the spectrum observed from light passing through a gaseous atmosphere shows sharper spectral lines.