Chapter 10. Global Happiness: Everything Up to the Paired-Samples t Test
Introduction
By Susan A. Nolan, Seton Hall University
Helliwell, J., Layard, R., & Sachs, J. (2016). World Happiness Report 2016, Update (Vol. I). New York: Sustainable Development Solutions Network. Opens in new window https://worldhappiness.report/ed/2016/
Helliwell, J., Layard, R., & Sachs, J. (2012). World Happiness Report 2012. New York: Sustainable Development Solutions Network. Opens in new window https://worldhappiness.report/ed/2012/
Introduction
In this activity, we’ll describe several findings from the World Happiness Report, which can be found here: https://worldhappiness.report/ed/2016/. Then you’ll identify the statistical analysis that could have been used to draw a conclusion.
Example 1 of 4
Do you celebrate World Happiness Day every March? Probably not. It’s not really that kind of holiday. But evidence suggests that it might help the world if we all took that day to examine happiness research and consider how we might make strides in increasing happiness around the world. With some support from the United Nations, the Gallup Organization, and other organizations, a group of independent researchers has regularly published a World Happiness Report since 2012, offering recommendations for policy makers based on their findings.


The 2016 report highlights patterns of self-reported happiness across countries, and within individual countries (Helliwell, Layard, & Sachs, 2016). Understanding well-being around the world has historically focused on economic measures, and sometimes health measures and education measures as well. But these measures may just be proxies for human happiness. In fact, subjective ratings of happiness depend on a range of factors like these – both those in our environment such as the economy and the government and those that are more specific to us as individuals, including health, education, and gender (Helliwell, Layard, & Sachs, 2012). The global happiness researchers suggest that we may be wiser to focus directly on increasing happiness. The next screen will describe one of the findings after which you will be asked to identify the statistical analysis that could have been used to draw a conclusion.
Example 1 of 4
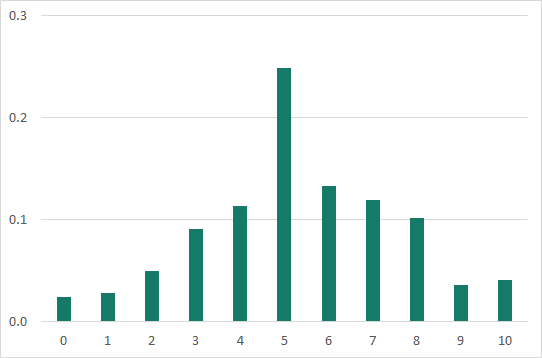
The World Happiness Report described the relatively normal distribution of happiness across countries. Here is a graph with those findings:
The relatively normal distribution of happiness across countries, Image Long Description
The global relatively normal distribution of happiness across countries on a scale of 0-10. The left column of the table below represents each of the 10 ladders. The second column represents the actual average happiness value.
| Ladder | World |
|---|---|
| 0 | 0,024 |
| 1 | 0,028 |
| 2 | 0,049 |
| 3 | 0,091 |
| 4 | 0,114 |
| 5 | 0,249 |
| 6 | 0,133 |
| 7 | 0,119 |
| 8 | 0,102 |
| 9 | 0,035 |
| 10 | 0,041 |
On a scale of 0-10, the researchers estimated a global mean of 5.353 and a standard deviation of 2.243. For the purposes of this example, let’s treat these as the actual population mean and standard deviation. The researchers also broke down countries into regions, one of which comprised Latin America and the Caribbean. Imagine that you randomly selected 10 countries from this region and found a mean happiness of 6.578 (which is, by the way, the actual mean for this region).
Example 1 of 4
What statistical analysis could be used to determine whether this region has a statistically significantly different mean from the global population mean?
Now skip ahead to the next example by clicking here. Or, for more practice walking through the flowchart questions, simply click the Next button in the bottom right corner of the screen.
Example 1 of 4
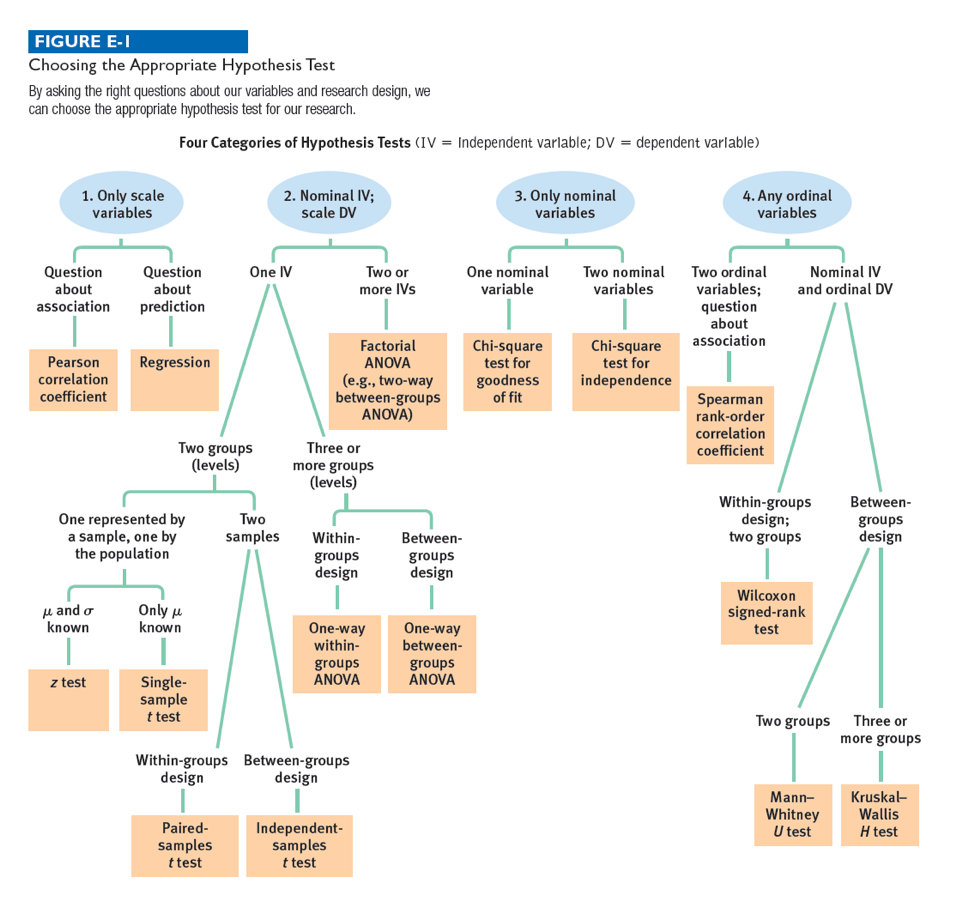
In which of the following four categories does this situation fall? Click if you’d like to see the data again. And click on the flowchart button if you’d like to see the overview for choosing the best test.
Example 1 of 4
How many nominal independent variables are there?
Example 1 of 4
How many levels does this independent variable have?
Example 1 of 4
How many samples are there?
Example 1 of 4
For the level represented by a population, what parameters are known with respect to the scale dependent variable?
Example 1 of 4
Based on the answers to these questions, what test could be used?
Example 2 of 4
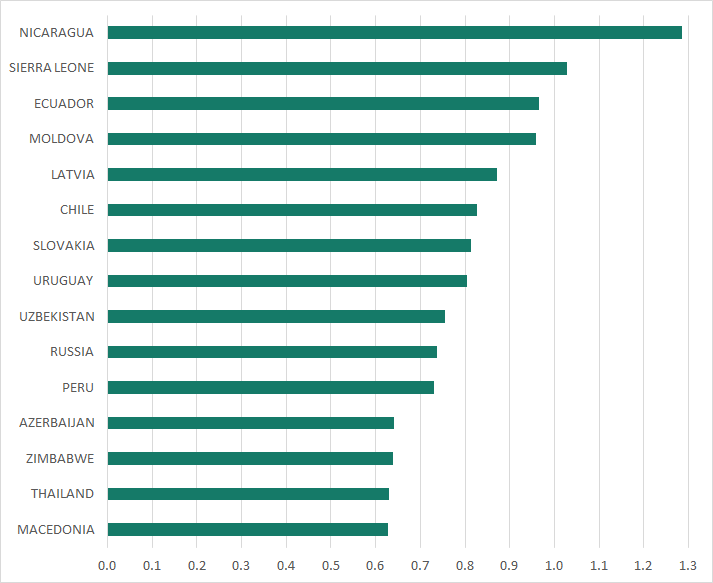
Now let’s take a look at another finding from The World Happiness Report, which provides a graph that displays the amount of change in happiness levels experienced by countries around the world. Below is an excerpt from that graph showing the countries with the biggest gains. Other countries saw little change in happiness levels, and still others saw decreases. The researchers used two data points – one between 2005 and 2007 and a second between 2013 and 2015 – to create this graph.
The amount of change in happiness levels experienced by countries around the world, Image Long Description
The amount of change in happiness levels experienced by countries around the world. The first column of the table below represents the country, and the second column represents the change in happiness.
| Country | Change in happiness |
|---|---|
| Macedonia | 0,627 |
| Thailand | 0,631 |
| Zimbabwe | 0,639 |
| Azerbaijan | 0,642 |
| Peru | 0,730 |
| Russia | 0,738 |
| Uzbekistan | 0,755 |
| Uruguay | 0,804 |
| Slovakia | 0,814 |
| Chile | 0,826 |
| Latvia | 0,872 |
| Moldova | 0,959 |
| Ecuador | 0,966 |
| Sierra Leone | 1,028 |
| Nicaragua | 1,285 |
Example 2 of 4
If we randomly selected 20 countries from the entire data set, not just the countries on the graph, we could analyze these data to determine if there were an overall shift in happiness levels around the world. For each of the 20 countries, we would have a happiness score from both time points. What statistical analysis could be used to answer this question?
Now skip ahead to the next example by clicking here. Or, for more practice walking through the flowchart questions, simply click the Next button in the bottom right corner of the screen.
Example 2 of 4
In which of the following four categories does this situation fall? Click if you’d like to see the findings again. And click on the flowchart button if you’d like to see the overview for choosing the best test.
The amount of change in happiness levels experienced by countries around the world, Image Long Description
The amount of change in happiness levels experienced by countries around the world. The first column of the table below represents the country, and the second column represents the change in happiness.
| Country | Change in happiness |
|---|---|
| Macedonia | 0,627 |
| Thailand | 0,631 |
| Zimbabwe | 0,639 |
| Azerbaijan | 0,642 |
| Peru | 0,730 |
| Russia | 0,738 |
| Uzbekistan | 0,755 |
| Uruguay | 0,804 |
| Slovakia | 0,814 |
| Chile | 0,826 |
| Latvia | 0,872 |
| Moldova | 0,959 |
| Ecuador | 0,966 |
| Sierra Leone | 1,028 |
| Nicaragua | 1,285 |
The graph displays the amount of change in happiness levels experienced by countries around the world. The researchers used two data points – one between 2005 and 2007 and a second between 2013 and 2015 – to create this graph. If we randomly selected 20 countries from the entire data set, not just the countries on the graph, we could analyze these data to determine if there were an overall shift in happiness levels around the world. For each of the 20 countries, we would have a happiness score from both time points. What statistical analysis would you use to answer this question?
Example 2 of 4
How many nominal independent variables are there?
Example 2 of 4
How many levels does this independent variable have?
Example 2 of 4
How many samples are there?
Example 2 of 4
What type of design is this?
Example 2 of 4
Based on the answers to these questions, what test could be used?
Example 3 of 4
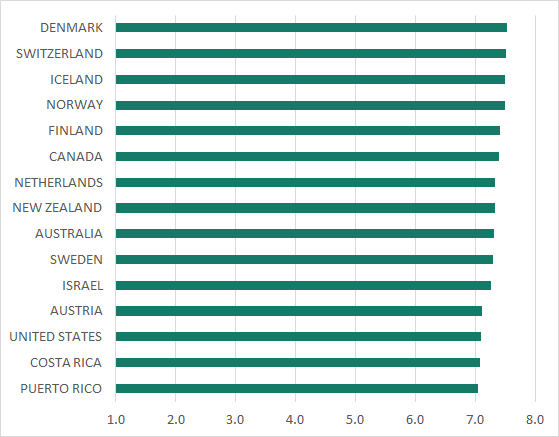
Let’s take a look at yet another finding from the World Happiness Report. The graph shows the top-fifteen ranked countries in the world for happiness level, according to the 2016 World Happiness Report. The mean happiness scores for each country are represented by the bars. For the purposes of this exercise, we’ll treat these as population means for these countries.
The top-fifteen ranked countries in the world for happiness level, Image Long Description
The graph showing the top-fifteen ranked countries in the world for happiness level. The first column of the table below represents the country, and the second column represents the happiness level.
| Country | Happiness |
|---|---|
| Puerto Rico | 7,039 |
| Costa Rica | 7,087 |
| United States | 7,104 |
| Austria | 7,119 |
| Israel | 7,267 |
| Sweden | 7,291 |
| Australia | 7,313 |
| New Zealand | 7,334 |
| Netherlands | 7,339 |
| Canada | 7,404 |
| Finland | 7,413 |
| Norway | 7,498 |
| Iceland | 7,501 |
| Switzerland | 7,509 |
| Denmark | 7,526 |
Example 3 of 4
We might use these means to ask questions about specific groups of people. For example, we might ask if university students in Canada have different average happiness levels than the general population of Canada. What statistical test could be used to explore this question?
Now skip ahead to the next example by clicking here. Or, for more practice walking through the flowchart questions, simply click the Next button in the bottom right corner of the screen.
Example 3 of 4
In which of the following four categories does this situation fall? Click if you’d like to see the findings again. And click on the flowchart button if you’d like to see the overview for choosing the best test.
The top-fifteen ranked countries in the world for happiness level, Image Long Description
The graph showing the top-fifteen ranked countries in the world for happiness level. The first column of the table below represents the country, and the second column represents the happiness level.
| Country | Happiness |
|---|---|
| Puerto Rico | 7,039 |
| Costa Rica | 7,087 |
| United States | 7,104 |
| Austria | 7,119 |
| Israel | 7,267 |
| Sweden | 7,291 |
| Australia | 7,313 |
| New Zealand | 7,334 |
| Netherlands | 7,339 |
| Canada | 7,404 |
| Finland | 7,413 |
| Norway | 7,498 |
| Iceland | 7,501 |
| Switzerland | 7,509 |
| Denmark | 7,526 |
The graph shows the top-fifteen ranked countries in the world for happiness level, according to the 2016 World Happiness Report. The mean happiness scores for each country are represented by the bars. For the purposes of this exercise, we’ll treat these as population means for these countries. We might use these means to ask questions about specific groups of people. For example, we might ask if university students in Canada have different average happiness levels than the general population of Canada. What statistical test would we use to explore this question?
Example 3 of 4
How many nominal independent variables are there?
Example 3 of 4
How many levels does this independent variable have?
Example 3 of 4
How many samples are there?
Example 3 of 4
For the level represented by a population, what parameters are known with respect to the scale dependent variable?
Example 3 of 4
Based on the answers to these questions, what test could be used?
Example 4 of 4
Let’s look at one last finding from the World Happiness Report, which monitored changes in happiness between 2005-2007 and 2013-2015. Based on these data, they reported that “the 10 countries with the largest declines in average life evaluations typically suffered some combination of economic, political and social stresses" (p. 28). For example, if you were following world news during those years, you wouldn’t be surprised that Greece, Venezuela, and Ukraine are among these countries.
Below is an excerpt from a graph that shows changes in all countries; this excerpt just shows the decline for the bottom 10. To create this graph, the researchers subtracted the happiness level from between 2005 and 2007 from the happiness level from between 2013 and 2015.
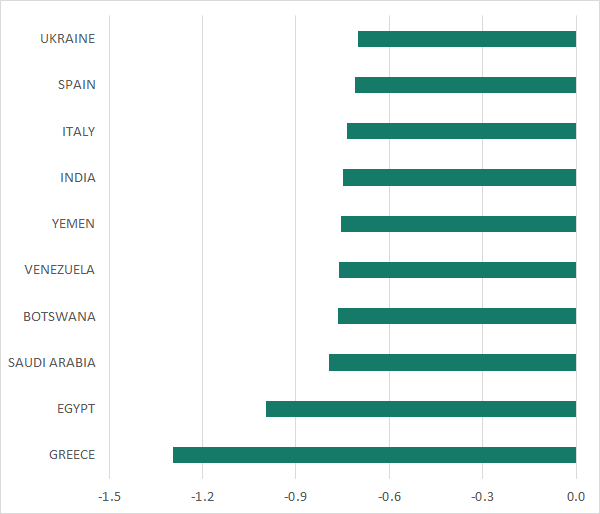
The bottom 10 countries with the largest declines in happiness, Image Long Description
Graph showing the bottom 10 countries with the largest declines in happiness. The first column of the table below represents the country, and the second column represents the negative change in the happiness level.
| Country | Happiness change |
|---|---|
| Greece | -1,294 |
| Egypt | -0,996 |
| Saudi Arabia | -0,794 |
| Botswana | -0,765 |
| Venezuela | -0,762 |
| Yemen | -0,754 |
| India | -0,750 |
| Italy | -0,735 |
| Spain | -0,711 |
| Ukraine | -0,701 |
Example 4 of 4
If we randomly selected 4 countries from among these 10, we could analyze these data to determine if there were a statistically significant shift in happiness levels among the worst-off countries. For each of the 4 countries, we would have a happiness score from both time points. What statistical analysis could be used to answer this question?
Now skip ahead to the end of the activity by clicking here. Or, for more practice walking through the flowchart questions, simply click the Next button in the bottom right corner of the screen.
Example 4 of 4
In which of the following four categories does this situation fall? Click if you’d like to see the findings again. And click on the flowchart button if you’d like to see the overview for choosing the best test.
The bottom 10 countries with the largest declines in happiness, Image Long Description
graph showing the bottom 10 countries with the largest declines in happiness. The first column of the table below represents the country, and the second column represents the negative change in the happiness level.
| Country | Happiness change |
|---|---|
| Greece | -1,294 |
| Egypt | -0,996 |
| Saudi Arabia | -0,794 |
| Botswana | -0,765 |
| Venezuela | -0,762 |
| Yemen | -0,754 |
| India | -0,750 |
| Italy | -0,735 |
| Spain | -0,711 |
| Ukraine | -0,701 |
Let’s look at one last finding from the World Happiness Report, which monitored changes in happiness between 2005-2007 and 2013-2015. Based on these data, they reported that “the 10 countries with the largest declines in average life evaluations typically suffered some combination of economic, political and social stresses" (p. 28). For example, if you were following world news during those years, you wouldn’t be surprised that Greece, Venezuela, and Ukraine are among these countries. This graph shows the decline for the bottom 10. To create this graph, the researchers subtracted the happiness level from between 2005 and 2007 from the happiness level from between 2013 and 2015. If we randomly selected 4 countries from among these 10, we could analyze these data to determine if there were a statistically significant shift in happiness levels among the 10 worst-off countries. What statistical analysis would you use to answer this question?
Example 4 of 4
How many nominal independent variables are there?
Example 4 of 4
How many levels does this independent variable have?
Example 4 of 4
How many samples are there?
Example 4 of 4
What type of design is this?
Example 4 of 4
Based on the answers to these questions, what test could be used?
10.1 Activity Completed!

Congratulations! You have completed the activity and gained some good experience in choosing the best hypothesis test.