Chapter 1. Successful Dieting: Everything Up to the Independent-Samples t Test
Introduction
By Warren Fass, University of Pittsburgh Bradford, and Susan A. Nolan, Seton Hall University
Pinola, M. (2016, February 12). The foods successful dieters eat more of, according to MyFitnessPal. Opens in new window https://lifehacker.com/the-foods-successful-dieters-eat-mUnsu10.ore-of-according-to-1758743956?utm_source=recirculation&utm_medium=recirculation&utm_campaign=fridayPM
Introduction

In this activity, we will consider various findings from the lifehacker.com article, "The Foods Successful Dieters Eat More Of, According to MyFitnessPal" (Pinola, 2016). Then you will identify statistical analyses that could be used to support the various conclusions.
Example 1 of 3

Have you ever tried to lose weight? If you are like us, and thousands of other people, you may have tried monitoring what you eat, following different diet plans, and/or exercising. With so many ads for weight loss methods, it can be confusing to figure out which option is best; however, there are a variety of Web sites and smart phone apps that might help.
For example, users of MyFitnessPal enter data (either on the Web site or on a smart phone) related to their food intake and the type of exercise performed (Pinola, 2016). MyFitnessPal has compiled these data from approximately 4.2 million users to distinguish the diets of successful dieters from those of unsuccessful dieters. MyFitnessPal operationally defined success in dieting as attaining a weight within 5% of the desired weight-loss goal. So, if you wanted to lose 20 pounds (9.1 kilograms), success would mean getting within 1 pound (0.5 kilogram) of that goal – that is, losing at least 19 pounds (8.6 kilograms). A total of 427,000 out of 4.2 million users met that criterion for successful dieters. The remaining 3.8 million users were considered the unsuccessful dieters. What can we learn from these data?
Example 1 of 3
What do successful dieters eat compared to unsuccessful dieters? The answer may be surprising. Let’s look at one of the findings obtained by MyFitnessPal (Pinola, 2016):
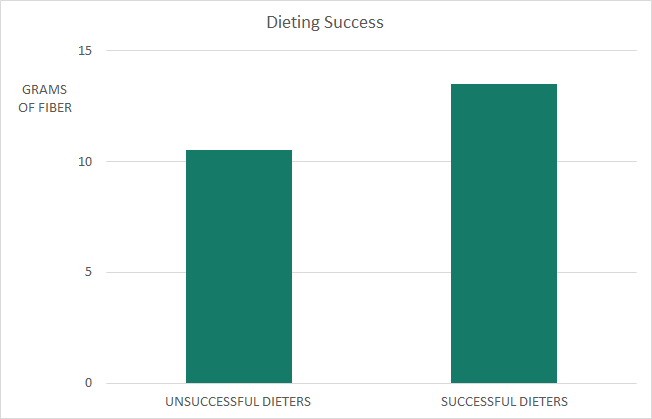
Mean daily fiber intake of unsuccessful and successful dieters, Image Long Description
The graph shows that successful dieters had a mean daily fiber intake of 13.5 grams and the unsuccessful dieters had a mean daily fiber intake of 10.5 grams. Consequently, successful dieters eat 29% more fiber.
| Grams of fiber | |
|---|---|
| Unsuccessful dieters | 10.5 |
| Successful dieters | 13.5 |
As indicated in the graph, successful dieters had a mean daily fiber intake of 13.5 grams and the unsuccessful dieters had a mean daily fiber intake of 10.5 grams.
Example 1 of 3
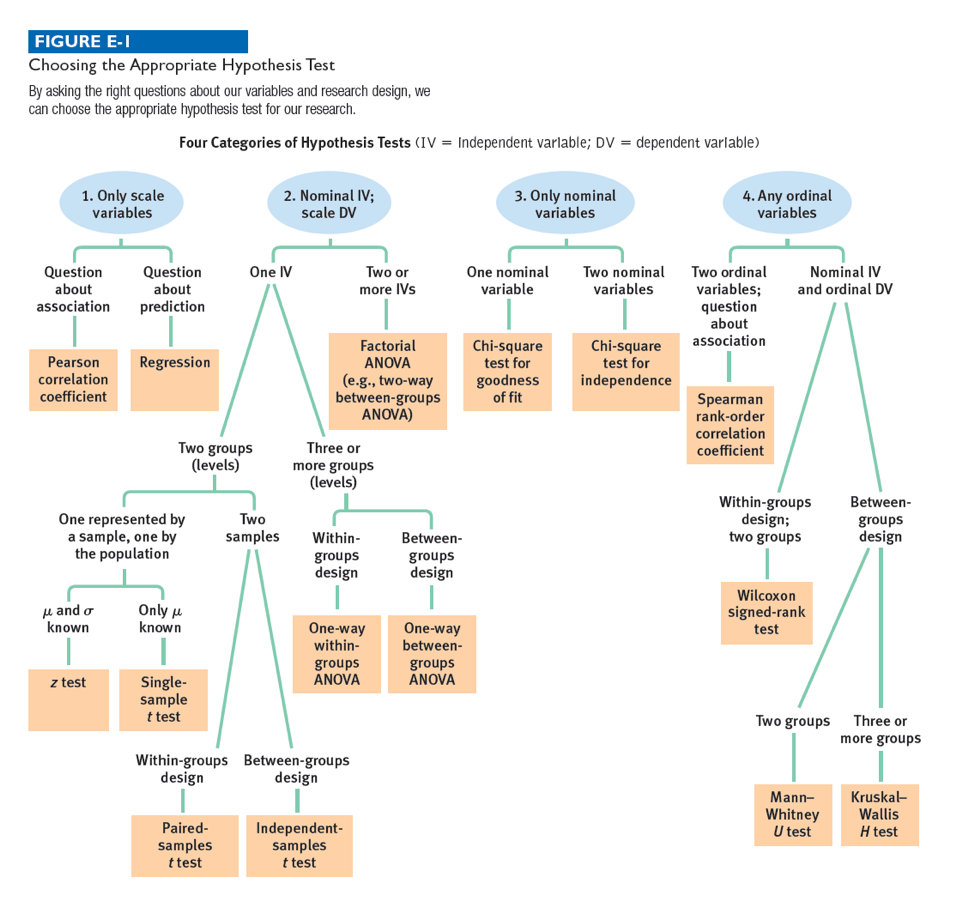
Which statistical test could be used to determine if the successful dieters consumed significantly more daily fiber than the unsuccessful dieters?
Now you can skip ahead to the next example by clicking here. Or, if you would like more practice walking through the flowchart questions, then simply click the Next button in the bottom right corner of the screen.
Example 1 of 3
In which of the following four categories does this situation fall? Click if you’d like to see the data again. And click on the flowchart button if you’d like to see the overview for choosing the best test.
What do successful dieters eat compared to unsuccessful dieters? The answer may be surprising. Let’s look at one of the findings obtained by MyFitnessPal (Pinola, 2016):
Mean daily fiber intake of unsuccessful and successful dieters, Image Long Description
The graph shows that successful dieters had a mean daily fiber intake of 13.5 grams and the unsuccessful dieters had a mean daily fiber intake of 10.5 grams. Consequently, successful dieters eat 29% more fiber.
| Grams of fiber | |
|---|---|
| Unsuccessful dieters | 10.5 |
| Successful dieters | 13.5 |
Example 1 of 3
How many nominal independent variables are there?
Example 1 of 3
How many levels does this independent variable have?
Example 1 of 3
How many samples are there?
Example 1 of 3
What type of design is this?
Example 1 of 3
Based on the answers to these questions, what statistical test could be used to determine if the successful dieters consumed significantly more daily fiber than the unsuccessful dieters?
Example 2 of 3
Now let’s look at another finding from MyFitnessPal (Pinola, 2016). As previously indicated, successful dieters attained a weight loss within 5% of their goals. What about the unsuccessful dieters? What percentage within their weight-loss goals did they attain? How different was that percentage from the successful dieter’s percentage? Unfortunately, the unsuccessful dieter’s percentage was not provided in the article. However, we can set-up the situation as if those data were provided. For the purposes of this example, let’s assume that the successful dieters attained a mean of 3.7% from their weight-loss goal. Imagine that you randomly selected 20 unsuccessful dieters, obtained their percentages within their weight-loss goal and found their mean for this sample was 9.95%, with a standard deviation of 2.866%.
Example 2 of 3
What statistical analysis could be used to determine whether the unsuccessful dieters attained a significantly different percentage from their weight-loss goal, on average, than did the successful dieters?
Now you can skip ahead to the next example by clicking here. Or, if you would like more practice walking through the flowchart questions, then simply click the Next button in the bottom right corner of the screen.
Example 2 of 3
In which of the following four categories does this situation fall? Click if you’d like to see the data again. And click on the flowchart button if you’d like to see the overview for choosing the best test.
Now let’s look at another finding from MyFitnessPal (Pinola, 2016). As previously indicated, successful dieters attained a weight-loss within 5% of their goals. What about the unsuccessful dieters? What percentage within their weight-loss goals did they attain? How different was that percentage from the successful dieter’s percentage? Unfortunately, the unsuccessful dieter’s percentage was not provided in the article. However, we can set-up the situation as if those data were provided. For the purposes of this example, let’s assume that the successful dieters attained a mean of 3.7% from their weight-loss goal. Imagine that you randomly selected 20 unsuccessful dieters, obtained their percentages within their weight-loss goal and found their mean for this sample was 9.95%, with a standard deviation of 2.866%.
Example 2 of 3
How many nominal independent variables are there?
Example 2 of 3
How many levels does this independent variable have?
Example 2 of 3
How many samples are there?
Example 2 of 3
For the level represented by a population, what parameters do you know with respect to the scale dependent variable?
Example 2 of 3
Based on the answers to these questions, what test could be used?
Example 3 of 3
Let’s look at a final set of data from MyFitnessPal (Pinola, 2016). MyFitnessPal researchers found that successful and unsuccessful dieters consumed similar percentages of calories from carbohydrates, fats, and proteins each day. However, as we can see in this bar graph, among all dieters, there seemed to be different percentages of calories consumed per day attributed to carbohydrates, fats, and proteins.
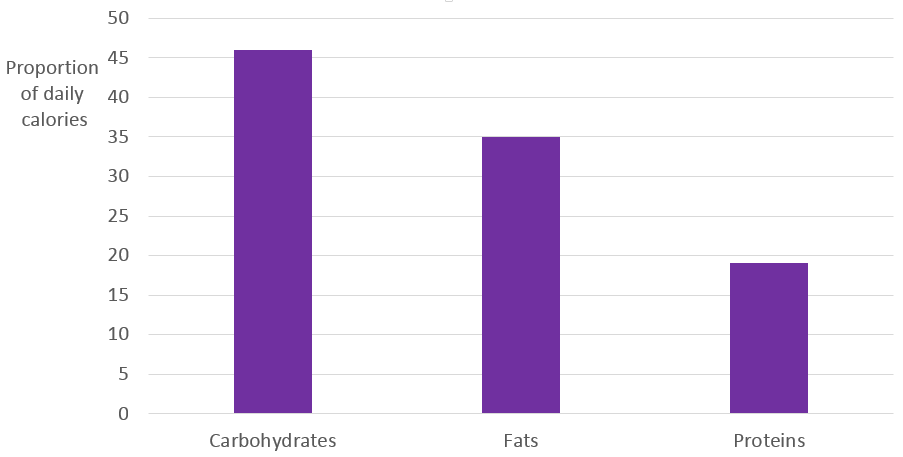
Percentages of calories from carbohydrates, fats, and proteins consumed by successful and unsuccessful dieters each day, Image Long Description
Both groups consumed 46% of carbs, 35% of fats and 19% of proteins.
| Proportion of daily calories | |
|---|---|
| Carbohydrates | 46 |
| Fats | 35 |
| Proteins | 19 |
Example 3 of 3
Imagine that you randomly selected 100 dieters and recorded the percentage of carbohydrate calories and the percentage of fat calories that each of them consumed in a day. What statistical test could be used to determine if the dieters consumed a significantly greater percentage of carbohydrate calories than fat calories per day?
Now you can skip ahead to the end of the activity by clicking here. Or, if you would like more practice walking through the flowchart questions, then simply click the Next button in the bottom right corner of the screen.
Example 3 of 3
In which of the following four categories does this situation fall? Click if you’d like to see the data again. And click on the flowchart button if you’d like to see the overview for choosing the best test.
Let’s look at a final set of data from MyFitnessPal (Pinola, 2016). The bar graph shows that successful and unsuccessful dieters consumed similar percentages of calories from carbohydrates, fats, and proteins each day. However, among all dieters, there seemed to be different percentages of calories consumed per day attributed to carbohydrates, fats, and proteins.
Percentages of calories from carbohydrates, fats, and proteins consumed by successful and unsuccessful dieters each day, Image Long Description
Both groups consumed 46% of carbs, 35% of fats and 19% of proteins.
| Proportion of daily calories | |
|---|---|
| Carbohydrates | 46 |
| Fats | 35 |
| Proteins | 19 |
Example 3 of 3
How many nominal independent variables are there?
Example 3 of 3
How many levels does this independent variable have?
Example 3 of 3
How many samples are there?
Example 3 of 3
What type of design is this?
Example 3 of 3
Based on the answers to these questions, what test could be used?
1.1 Activity Completed!

Congratulations! You have completed the activity and gained some good experience in choosing the best hypothesis test.