Introduction
(Slide 1 of 33)

Chapter 12. Serial Killers: Everything Up to One-Way Between-Groups ANOVA

Which Test Is Best?
true
true
You must read each slide, and complete any questions on the slide, in sequence.

Serial Killers: Everything Up to One-Way Between-Groups ANOVA

By Marsha J. McCartney, University of Kansas, and Susan A. Nolan, Seton Hall University

List of serial killers by number of victims. (n.d.). In Wikipedia. Retrieved October 18, 2015, from Opens in new window https://en.wikipedia.org/wiki/List_of_serial_killers_by_number_of_victims

Serial Killers: Everything Up to One-Way Between-Groups ANOVA

Admit it—at some point, you’ve probably been fascinated by the story of a serial killer and tried to understand why they are motivated to kill. It might have been someone fictional, like Hannibal Lector or Dexter, or someone in real life, like Jeffrey Dahmer or Ted Bundy. Their utter disregard for life is horrifying, but thankfully serial killers are extremely rare.
If you want to learn more, Wikipedia has a fairly comprehensive listing of serial killers that have been active from around 1900 to today: https://en.wikipedia.org/wiki/List_of_serial_killers_by_number_of_victims. This page lists the serial killers' names, the countries they are associated with, the years in which they were active, the number of known victims, and the number of possible victims. This is a goldmine of data for someone interested in learning more about serial killers—or someone who likes doing statistical analyses!

Serial Killers: Everything Up to One-Way Between-Groups ANOVA

It is Halloween night. You and your roommates stay in for a horror movie marathon about serial killers. You watch Scream, American Psycho, Se7en, and Nightmare on Elm Street. You all have a great time getting scared and laughing with each other, but around 3 am you notice that everyone except you has fallen asleep during the last movie. And now there is no way you’re falling asleep. There are shadows and noises, which you hope are harmless, but you turn on every light in your apartment anyway. You decide to find out how likely it is that a serial killer could be active near you by looking at the Wikipedia data.
Let’s compare the mean numbers of known victims of serial killers across countries in which the primary language is English. The data include the numbers of known victims for each serial killer, as well as the country in which the murders took place. So, we can calculate means for a sample of the serial killers in each country. We’ll compare the mean for the samples of serial killers from Australia, Canada, the United States, and the United Kingdom.

The mean numbers of known victims of serial killers across primarily English-speaking countries.
Data from: https://en.wikipedia.org/wiki/List_of_serial_killers_by_number_of_victims(2015)

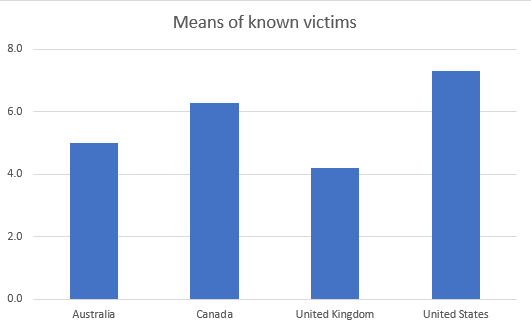
The mean numbers of known victims of serial killers across primarily English-speaking countries, Image Long Description

The mean numbers of known victims of serial killers across primarily English-speaking countries. The left column represents the country, and the right column contains the corresponding value.
Australia 5.0
Canada 6.3
United Kingdom 4.2
United States 7.3

Serial Killers: Everything Up to One-Way Between-Groups ANOVA

What analysis could be used to see if there are significant differences in the mean numbers of victims of serial killers in Australia, Canada, the United States, and the United Kingdom?


Correct! The researchers could have used a one-way between-groups ANOVA. There is one nominal independent variable, country. There are four levels/groups: Australia, Canada, the United Kingdom, and the United States. The scale dependent variable is number of victims of each serial killer. Each serial killer was active in only one country, so this is a between-groups design.
 
Now skip ahead to the next example by clicking here. Or, for more practice walking through the flowchart questions, simply click the Next button in the bottom right corner of the screen.
Actually, that’s not the correct statistical analysis. Let’s walk through the questions on the flowchart in Appendix E to determine what analysis could be used in this case.

Guidelines for choosing the appropriate hypothesis test

Serial Killers: Everything Up to One-Way Between-Groups ANOVA

In which of the following four categories does this situation fall? Click if you’d like to see the data again. And click on the flowchart button to see the overview for choosing the best test.


Correct! There is at least one nominal independent variable and a scale dependent variable.
Actually, there is at least one nominal independent variable and a scale dependent variable.

Serial Killers: Everything Up to One-Way Between-Groups ANOVA

How many nominal independent variables are there?


Correct! There is one nominal independent variable, country. (The dependent variable, the number of victims of each serial killer, is scale.)
Actually, there is one nominal independent variable, country. (The dependent variable, number of victims of each serial killer, is scale.)

Serial Killers: Everything Up to One-Way Between-Groups ANOVA

How many levels does this independent variable have?


Correct! There are four levels or groups: Australia, Canada, the United States, and the United Kingdom.
Actually, there are four levels or groups: Australia, Canada, the United States, and the United Kingdom.

Serial Killers: Everything Up to One-Way Between-Groups ANOVA

What type of design is this?


Correct! The number of victims for each serial killer only occurs in one country, so this is a between-groups design.
Actually, the number of victims for each serial killer only occurs in one country, so this is a between-groups design.

Serial Killers: Everything Up to One-Way Between-Groups ANOVA

What analysis сould be used to see if there are significant differences in the numbers of known victims of serial killers in Australia, Canada, the United States, and the United Kingdom?


Correct! The researchers could have used a one-way between-groups ANOVA. There is one nominal independent variable, country. There are four levels/groups: Australia, Canada, the United Kingdom, and the United States. The scale dependent variable is the number of known victims for each serial killer. Each serial killer was active in only one country, so this is a between-groups design.
Actually, the researchers could have used a one-way between-groups ANOVA. There is one nominal independent variable, country. There are four levels/groups: Australia, Canada, the United Kingdom, and the United States. The scale dependent variable is the number of known victims of each serial killer. Each serial killer was active in only one country, so this is a between-groups design.

Serial Killers: Everything Up to One-Way Between-Groups ANOVA

In the previous analysis, a one-way between-groups ANOVA shows that there are significant differences among the four countries, and the post hoc tests show that only the United States (M=7.6, SD=6.3) has significantly more known victims per serial killer than the United Kingdom (M=4.4, SD=2.3), but is NOT significantly different from Canada or Australia. But, how bad is North America? For the next analysis, let’s compare a random sample of serial killers from North America, to see if there is a significantly different number of known victims than in all countries, combined. For the North American sample, we can calculate a mean and standard deviation. We can compare the sample mean and standard deviation to the population mean and standard deviation for all serial killers in the worldwide database.

The mean number of known victims of serial killers in North America compared to that of all countries combined.
Data from: https://en.wikipedia.org/wiki/List_of_serial_killers_by_number_of_victims(2015)

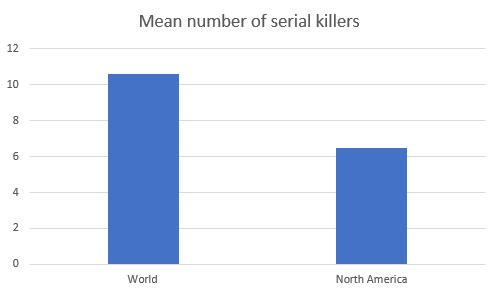
Mean number of serial killers by continent, Image Long Description

The mean number of known victims of serial killers in North America compared to that of all countries combined. The left column is the country or the world, and the right column contains the corresponding value.
World 10.6
North America 6.5

Serial Killers: Everything Up to One-Way Between-Groups ANOVA

What analysis could be used to find out if the mean number of known victims for North American serial killers is significantly different from the mean for all the countries in the world?


Correct! The researchers could have used a z test. There is one nominal variable, region of the world. There are two levels/groups, North America and the entire world. We randomly selected a sample of serial killers from North America, and we are comparing it to the population mean for the entire world. The scale dependent variable is the number of known victims per serial killer. We know the mean and standard deviation for the population of serial killers in the worldwide database.
 
Now skip ahead to the next example by clicking here. Or, for more practice walking through the flowchart questions, simply click the Next button in the bottom right corner of the screen.
Actually, that’s not the correct statistical analysis. Let’s walk through the questions on the flowchart in Appendix E to determine what analysis could be used in this case.

Serial Killers: Everything Up to One-Way Between-Groups ANOVA

In which of the following four categories does this situation fall? Click if you’d like to see the data again. And click on the flowchart button to see the overview for choosing the best test.


Correct! There is at least one nominal independent variable and a scale dependent variable.
Actually, there is at least one nominal independent variable and a scale dependent variable.

Serial Killers: Everything Up to One-Way Between-Groups ANOVA

How many nominal independent variables are there?


Correct! There is one nominal independent variable, region of the world. (The dependent variable, the number of known victims per serial killer, is scale.)
Actually, there is one nominal independent variable, region of the world. (The dependent variable, the number of known victims per serial killer, is scale.)

Serial Killers: Everything Up to One-Way Between-Groups ANOVA

How many levels does this independent variable have?


Correct! There are two levels or groups: North America and the world.
Actually, there are two levels or groups: North America and the world.

Serial Killers: Everything Up to One-Way Between-Groups ANOVA

How many samples are there?


Correct! There is one sample, randomly selected serial killers from North American countries, and the second level is represented by the population, all serial killers in the entire world.
Actually, there is one sample, randomly selected serial killers from North American countries, and the second level is represented by the population, all serial killers in the entire world.

Serial Killers: Everything Up to One-Way Between-Groups ANOVA

For the level represented by a population, what parameters are known with respect to the scale dependent variable?


Correct! For the scale dependent variable, the number of known victims per serial killer, we know both the population mean and the population standard deviation.
Actually, for the scale dependent variable, the number of known victims per serial killer, we know both the population mean and the population standard deviation.

Serial Killers: Everything Up to One-Way Between-Groups ANOVA

What analysis could be used to find out if the number of serial killers in the countries in North America is significantly different than in all the countries in the world?


Correct! The researchers could have used a z test. There is one nominal variable, region of the world. There are two levels/groups, North America and the world. The sample includes randomly selected serial killers from North America, and the population is all serial killers in the world. The scale dependent variable is the number of known victims per serial killer. We know the mean and standard deviation for the population of serial killers in the worldwide database.
Actually, the researchers could have used a z test. There is one nominal variable, region of the world. The sample includes randomly selected serial killers from North America, and the population is all serial killers in the world. The scale dependent variable is the number of known victims per serial killer. We know the mean and standard deviation for the population of serial killers in the worldwide database.

Serial Killers: Everything Up to One-Way Between-Groups ANOVA

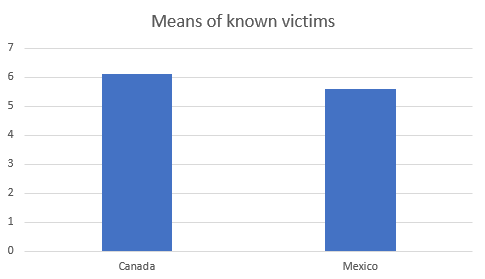
The previous analysis showed that North America has significantly more known victims per serial killer than the entire population in the worldwide serial killer database. This doesn’t make you feel any better, especially as your roommates are all still asleep. Next, you decide to compare the numbers of known victims of randomly selected samples of serial killers from Canada and Mexico. We can calculate means and standard deviations for the sample of serial killers from each country.

The mean numbers of known victims of serial killers from Canada and Mexico.
Data from: https://en.wikipedia.org/wiki/List_of_serial_killers_by_number_of_victims(2015)

The mean numbers of known victims of serial killers from Canada and Mexico, Image Long Description

The mean numbers of known victims of serial killers from Canada and Mexico. The left column is the country, and the right column contains the corresponding value.
Canada 6.10
Mexico 5.6

Serial Killers: Everything Up to One-Way Between-Groups ANOVA

What analysis could be used to see if there are significant differences in the number of victims of serial killers in Canada and Mexico?


Correct! The researchers could have used an independent-samples t test. The independent variable, countries, is nominal, and has two levels, Canada and Mexico. There are different serial killers in each sample, making this a between-groups design. The dependent variable, the number of proven victims per serial killer, is scale.
 
Now skip ahead to the next example by clicking here. Or, for more practice walking through the flowchart questions, simply click the Next button in the bottom right corner of the screen.
Actually, that’s not the correct statistical analysis. Let’s walk through the questions on the flowchart in Appendix E to determine what analysis could be used in this case.

Serial Killers: Everything Up to One-Way Between-Groups ANOVA

In which of the following four categories does this situation fall? Click if you’d like to see the data again. And click on the flowchart button to see the overview for choosing the best test.


Correct! There is at least one nominal independent variable and a scale dependent variable.
Actually, there is at least one nominal independent variable and a scale dependent variable.

Serial Killers: Everything Up to One-Way Between-Groups ANOVA

How many nominal independent variables are there?


Correct! There is one nominal independent variable, country. (The dependent variable, the number of known victims per serial killer, is scale.)
Actually, there is one nominal independent variable, country. (The dependent variable, the number of known victims per serial killer, is scale.)

Serial Killers: Everything Up to One-Way Between-Groups ANOVA

How many levels does this independent variable have?


Correct! There are two levels/groups, Canada and Mexico.
Actually, there are two levels/groups, Canada and Mexico.

Serial Killers: Everything Up to One-Way Between-Groups ANOVA

How many samples are there?


Correct! There are two samples, one for Canada and one for Mexico.
Actually, there are two samples, one for Canada and one for Mexico.

Serial Killers: Everything Up to One-Way Between-Groups ANOVA

What type of design is this?


Correct! Each serial killer has victims in just one country, so it is a between-groups design.
Actually, each serial killer has victims in just one country, so it is a between-groups design.

Serial Killers: Everything Up to One-Way Between-Groups ANOVA

What analysis could be used to see if there are significant differences in the number of victims of serial killers in Canada and Mexico?


Correct! The researchers could have used an independent-samples t tests, because there is one nominal independent variable, country, with two levels or groups: Canada and Mexico. There is a scale dependent variable, number of known victims per serial killer. And the participants (serial killers) are only in one of the two groups, so it is a between-groups design.
Actually, the researchers could have used an independent-samples t tests, because there is one nominal independent variable, country, with two levels or groups: Canada and Mexico. There is a scale dependent variable, number of known victims per serial killer. And the participants (serial killers) are only in one of the two groups, so it is a between-groups design.

Serial Killers: Everything Up to One-Way Between-Groups ANOVA

The sky outside lightens as the sun starts to rise, and the statistical analyses you’ve been running all night have helped take the edge off your fear. However, a few words of comfort and wisdom from your grandfather would be nice. He is an early riser, so you know he’ll be up. And he is always urging you to call anytime, so this is a great opportunity.
While you’re on the phone, you start to tell your grandfather about the data from your serial killer research. He starts to talk about how, in his day, you heard about somebody getting killed by a serial killer nearly every day on the news. Your grandfather tells you that it was much worse back then. You realize you have data about when these serial killers were active, so you can compare the numbers of known victims of serial killers by decade. For each decade, you randomly select a sample of serial killers active only at that time. You can calculate means and standard deviations for the 1920s, 1960s, and the 2000s.

The mean numbers of known victims of serial killers by decade.
Data from: https://en.wikipedia.org/wiki/List_of_serial_killers_by_number_of_victims(2015)

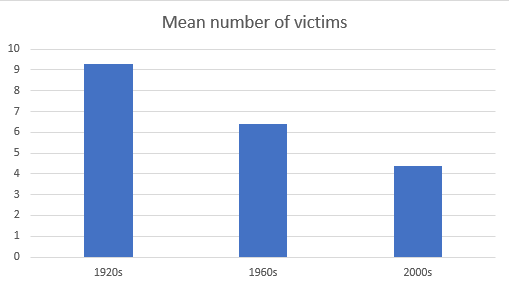
The mean numbers of known victims of serial killers by decade, Image Long Description

The mean numbers of known victims of serial killers by decade. The left column is the decade, and the right column contains the corresponding value.
1920s 9.3
1960s 6.4
2000s 4.4

Serial Killers: Everything Up to One-Way Between-Groups ANOVA

What analysis could be used to see if there are significant differences in the number of victims of serial killers by decade?


Correct! The researchers could have used a one-way between-groups ANOVA. There is one nominal independent variable, decades. There are three levels/groups: the 1920s, the 1960s, and the 2000s. The scale dependent variable is the number of known victims per serial killer in each decade. Each serial killer is counted only in one decade, so this is a between-groups design.
 
Now skip ahead to the end of the activity by clicking here. Or, for more practice walking through the flowchart questions, simply click the Next button in the bottom right corner of the screen.
Actually, that’s not the correct statistical analysis. Let’s walk through the questions on the flowchart in Appendix E to determine what analysis could be used in this case.

Serial Killers: Everything Up to One-Way Between-Groups ANOVA

In which of the following four categories does this situation fall? Click if you’d like to see the data again. And click on the flowchart button to see the overview for choosing the best test.


Correct! There is at least one nominal independent variable and a scale dependent variable.
Actually, there is at least one nominal independent variable and a scale dependent variable.

Serial Killers: Everything Up to One-Way Between-Groups ANOVA

How many nominal independent variables are there?


Correct! There is one nominal independent variable, decade. (The dependent variable, the number of known victims per serial killer, is scale.)
Actually, there is one nominal independent variable, decade. (The dependent variable, the number of known victims per serial killer, is scale.)

Serial Killers: Everything Up to One-Way Between-Groups ANOVA

How many levels does the independent variable have?


Correct! There are three levels/groups: the 1920s, the 1960s, and the 2000s.
Actually, there are three levels/groups: the 1920s, the 1960s, and the 2000s.

Serial Killers: Everything Up to One-Way Between-Groups ANOVA

What type of design is this?


Correct! Each serial killer is counted only in one decade, so this is a between-groups design.
Actually, each serial killer is counted only in one decade, so this is a between-groups design.

Serial Killers: Everything Up to One-Way Between-Groups ANOVA

What analysis could be used to see if there are significant differences in the number of victims of serial killers by decade?


Correct! The researchers could have used a one-way between-groups ANOVA. There is one nominal independent variable, decade. There are three levels/groups: the 1920s, the 1960s, and the 2000s. The scale dependent variable is the number of known victims per serial killer in each decade. Each serial killer is counted only in one decade, so this is a between-groups design.
Actually, the researchers could have used a one-way between-groups ANOVA. There is one nominal independent variable, decade. There are three levels/groups: the 1920s, the 1960s, and the 2000s. The scale dependent variable is the number of known victims per serial killer in each decade. Each serial killer is counted only in one decade, so this is a between-groups design.

Congratulations! You have completed the activity and gained some good experience in choosing the best hypothesis test.