Chapter 13. Job Hunting: Everything up to One-Way Within-Groups ANOVA
Introduction
By: Warren Fass, University of Pittsburgh Bradford, Marsha J. McCartney, University of Kansas, and Susan A. Nolan, Seton Hall University
National Center for O*NET Development. (2017). O*NET OnLine. Retrieved from Opens in new window https://www.onetonline.org/.
Introduction

Students enter college with different expectations and knowledge about their future careers. Some know exactly what career they want, and seek the degree to prepare for that career. Others only know that they will need a degree to obtain a job, but are uncertain which major would provide adequate preparation (e.g., coursework, applied experiences). Still others know what their major would be, but lack the knowledge related to the types of jobs for which that major prepares them. Fortunately, there are various career-related online database sites (e.g., Career Builder, Occupational Outlook Handbook, O*NET Online) that might assist students with career decisions. For this activity, we will explore career-related information from the O*NET Online database. You can use that database to search for occupations related to your skills, view salary information, compare related occupations, and more.
Example 1 of 5
O*NET allows students to explore the expected job growth for a variety of industries. For example, a total of 143 different job titles are categorized as health care and social assistance (e.g., physician assistants, registered nurses, and mental health counselors). Additionally, 134 different job titles are categorized as educational services (e.g., special education teachers, education administrators, and criminal justice post-secondary teachers). For each job title, O*NET provides the number of projected job openings for a 10-year period (2014-2024). Imagine that we randomly selected 40 different job titles from the health care and social assistance occupation category, and 40 different job titles from the educational services occupation category. We then record the projected number of jobs for each job title during the 10-year time period.
Which statistical test could be used to determine if there was a significant difference in the number of projected jobs between the two groups?
Now skip ahead to the next example by clicking here. Or, for more practice walking through the flowchart questions, simply click the Next button in the bottom right corner of the screen.
Example 1 of 5
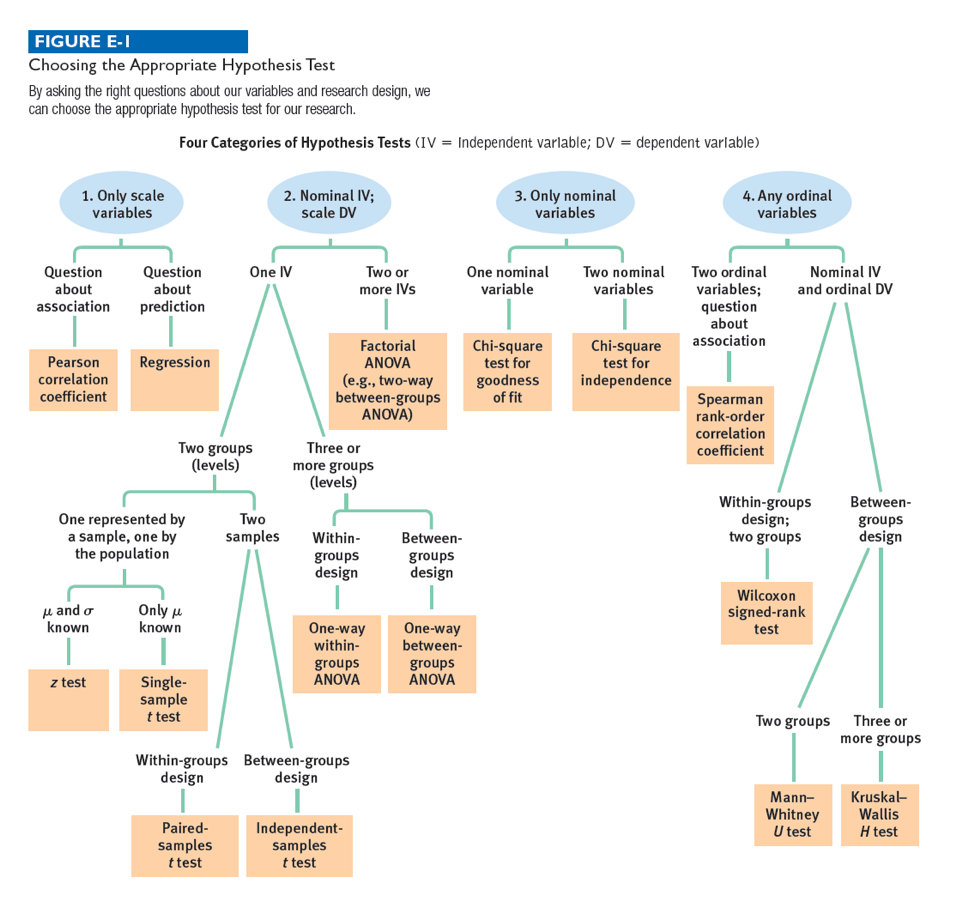
In which of the following four categories does this situation fall? Click to see the data again. And click on the flowchart button to see the overview for choosing the best test.
Example 1 of 5
How many nominal independent variables are there?
Example 1 of 5
How many levels does the independent variable have?
Example 1 of 5
How many samples are there?
Example 1 of 5
What type of design is this?
Example 1 of 5
Based on the answers to these questions, what statistical analysis could be used to determine if there was a significant difference in the number of projected jobs between the two groups?
Example 2 of 5
The O*NET site also sorts occupations by ‘job zones’ based on the required levels of education, experience, and training. For example, occupations in the Job Zone 1 category require little or no preparation (e.g., may require either a high school degree or GED, minimal work experience related to the occupation). Occupations categorized in Job Zones 2, 3, and 4 increase in the level of preparation required for the occupation. Occupations in the Job Zone 5 category require extensive preparation (e.g., graduate school degree, more than 3 years of post-graduate degree experience). So, the larger the job zone number, the more experience and preparation necessary for that occupation. For example, there are 40 occupations (e.g., laundry/dry-cleaner, dishwasher) listed in Job Zone 1, and 159 occupations (e.g., statistician, counseling psychologist, biologist) listed in Job Zone 5. Do first-semester university students have preferences for different occupations based on job zone?
Imagine that we recruited 90 first-semester university students as participants. We randomly assign 30 of the participants to each of three groups. One group reads a vignette containing a description of qualifications for a generic occupation using O*NET’s criteria for Job Zone 3 (medium preparation); one group reads a vignette containing a description of qualifications for a generic occupation using criteria for Job Zone 4 (considerable preparation); and finally, one group reads a vignette containing a description of qualifications of a generic occupation using criteria for Job Zone 5 (extensive preparation). After reading their respective vignettes, all participants are asked to rate, on a 7-point scale, their preference (1 = very little, 7 = a lot) for the occupation described in the vignette.
Which statistical test could be used to determine if there was a significant difference in preference ratings among the three groups?
Now skip ahead to the next example by clicking here. Or, for more practice walking through the flowchart questions, simply click the Next button in the bottom right corner of the screen.
Example 2 of 5
In which of the following four categories does this situation fall? Click to see the data again. And click on the flowchart button to see the overview for choosing the best test.
Imagine that we recruited 90 first-semester university students as participants. We randomly assign 30 of the participants to each of three groups. One group reads a vignette containing a description of qualifications for a generic occupation using O*NET’s criteria for Job Zone 3 (medium preparation); one group reads a vignette containing a description of qualifications for a generic occupation using criteria for Job Zone 4 (considerable preparation); and finally, one group reads a vignette containing a description of qualifications of a generic occupation using criteria for Job Zone 5 (extensive preparation). After reading their respective vignettes, all participants are asked to rate, on a 7-point scale, their preference (1 = very little, 7 = a lot) for the occupation described in the vignette.
Example 2 of 5
How many nominal independent variables are there?
Example 2 of 5
How many levels does this independent variable have?
Example 2 of 5
What type of design is this?
Example 2 of 5
Based on the answers to these questions, what statistical analysis could be used to determine if there was a significant difference in preference ratings among the three groups?
Example 3 of 5
Are you concerned about preserving and improving the environment, conservation, recycling, or sustainability? If the answer is yes, then you may be interested in exploring the O*NET database for occupations that are considered ‘green occupations.’ The database contains 12 categories of green occupations (e.g., environment protection, energy efficiency, green construction). Imagine that we recruited 40 undergraduates to participate in the following study: We selected three green job categories: 1) environment protection, 2) energy efficiency, and 3) green construction, and ask the participants to rate their interest in each category on a 10-point scale (1 = not very, 10 = very).
Which statistical test could be used to determine if there was a significant difference in interest ratings among the three groups?
Now skip ahead to the next example by clicking here. Or, for more practice walking through the flowchart questions, simply click the Next button in the bottom right corner of the screen.
Example 3 of 5
In which of the following four categories does this situation fall? Click to see the data again. And click on the flowchart button to see the overview for choosing the best test.
Example 3 of 5
How many nominal independent variables are there?
Example 3 of 5
How many levels does this independent variable have?
Example 3 of 5
What type of design is this?
Example 3 of 5
Based on the answers to these questions, what statistical analysis could be used to determine if there was a significant difference in interest ratings among the three groups?
Example 4 of 5
The O*NET database provides information for the 10-year (2014-2024) projected percentage increase in the number of jobs for over 900 occupations (e.g., occupational therapy assistant, computer systems analyst, credit counselors) in the U.S. You have decided to pursue a degree as an occupational therapy assistant due in part to a substantial projected percentage increase in jobs between 2014-2024. The projected mean percent increase for occupational therapy assistant jobs during the 10-year period for the entire United States is 42.70. You want to obtain a job in a state east of the Mississippi River (e.g., New York, New Jersey, Michigan). You randomly select a sample of 12 of these states east of the Mississippi River and calculate a projected mean percent increase of 44.19, with a standard deviation of 10.62.
What statistical analysis could you use to determine whether the states east of the Mississippi River have a significantly different projected percentage increase in jobs, on average, than all of the states in the U.S.?
Now skip ahead to the next example by clicking here. Or, for more practice walking through the flowchart questions, simply click the Next button in the bottom right corner of the screen.
Example 4 of 5
In which of the following four categories does this situation fall? Click to see the data again. And click on the flowchart button to see the overview for choosing the best test.
Example 4 of 5
How many nominal independent variables are there?
Example 4 of 5
How many levels does the independent variable have?
Example 4 of 5
How many samples are there?
Example 4 of 5
For the level represented by a population, what parameters are known with respect to the scale dependent variable?
Example 4 of 5
Based on the answers to these questions, what statistical analysis could you use to determine whether the sample of states east of the Mississippi River has a significantly different projected percentage increase in jobs, on average, than all of the states in the U.S.?
Example 5 of 5
Let’s look at one final example using data from O*NET. O*NET has created a category for 392 occupations called, Bright Outlook occupations. Those occupations (e.g., carpenter, critical care nurse, radiologist) are “expected to grow rapidly in the next several years, will have large numbers of job openings, or are new and emerging occupations.” Do you think the same occupation would have identical salaries regardless of the location (i.e., state) of employment? Unfortunately, the salary data for each occupation obtainable from O*NET are medians; however, we will use salary means in our example. Imagine that we are interested in comparing salaries for two states, Texas and Ohio. We then randomly select 40 of the 392 Bright Outlook occupations that are listed for both states. We calculate salary means for those 40 occupations for both Texas and Ohio.
Which statistical test could be used to determine if there was a significant difference in salaries between the two states?
Now skip ahead to the end of the activity by clicking here. Or, for more practice walking through the flowchart questions, simply click the Next button in the bottom right corner of the screen.
Example 5 of 5
In which of the following four categories does this situation fall? Click to see the data again. And click on the flowchart button to see the overview for choosing the best test.
Example 5 of 5
How many nominal independent variables are there?
Example 5 of 5
How many levels does the independent variable have?
Example 5 of 5
How many samples are there?
Example 5 of 5
What type of design is this?
Example 5 of 5
Based on the answers to these questions, which statistical test could be used to determine if there was a significant difference between the salary means from the two groups?
13.1 Activity Completed!

Congratulations! You have completed the activity and gained some good experience in choosing the best hypothesis test.