Chapter 14. Online Dating: Everything up to Factorial ANOVA (two-way between-groups ANOVA)
Introduction
By: Marsha J. McCartney, University of Kansas, Warren Fass, University of Pittsburgh Bradford, and Susan A. Nolan, Seton Hall University
A woman’s advantage. (2016). The deep end by OkCupid. Retrieved February 5, 2017, from Opens in new window https://www.okcupid.com/deep-end/a-womans-advantage
Introduction

Lots of people find dates online. There are plenty of articles about how best to meet someone in the online dating world, and it seems that everyone has an opinion. Can the data collected by these sites shed light on what leads to a successful relationship? That is actually a pretty complex question, statistically speaking, so let’s look at a few different ways that one online dating site, OkCupid, uses data to understand successful online dating.
Example 1 of 5
One of the surprising findings presented in the OkCupid article, “A women’s advantage,” was that women prefer to split the bill on a first date more than men. Imagine that we recruited 20 male and 20 female undergraduates. We ask the participants to rate the likelihood, on a 5-point rating scale (1 = never, 5 = always), that they would want to split the bill on a first date.
Which statistical test could be used to determine if there was a significant difference in preference ratings between the two groups?
Now skip ahead to the next example by clicking here. Or, for more practice walking through the flowchart questions, simply click the Next button in the bottom right corner of the screen.
Example 1 of 5
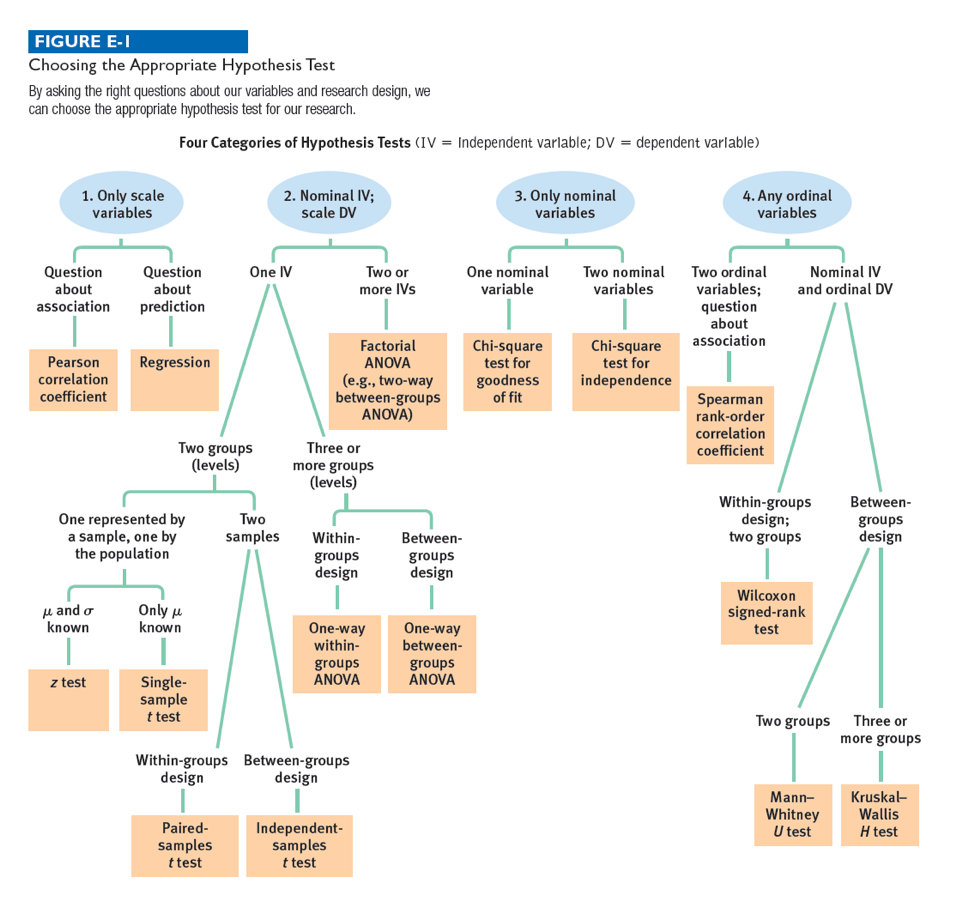
In which of the following four categories does this situation fall? Click to see the data again. And click on the flowchart button to see the overview for choosing the best test.
Example 1 of 5
How many nominal independent variables are there?
Example 1 of 5
How many levels does the independent variable have?
Example 1 of 5
How many samples are there?
Example 1 of 5
What type of design is this?
Example 1 of 5
Based on the answers to these questions, what statistical analysis could be used to determine if there was a significant difference in preference ratings between the two groups?
Example 2 of 5
OkCupid also provided information about the numbers of messages sent by men and women in relation to their ages. OkCupid looked at different age ranges (e.g., 21-30-years-old, 31-40-years-old) and counted the number of messages sent by men and women from each age range. Imagine that OkCupid provided us with the following data from one month: The total number of messages sent for 50 men and 50 women from both of the following age groups, between 21-30-years-old and between 31-40-years old. We would then have data from 200 users of OkCupid.
Which statistical test could be used to determine if there were significant differences in the number of messages sent among the four groups?
Now skip ahead to the next example by clicking here. Or, for more practice walking through the flowchart questions, simply click the Next button in the bottom right corner of the screen.
Example 2 of 5
In which of the following four categories does this situation fall? Click to see the data again. And click on the flowchart button to see the overview for choosing the best test.
OkCupid also provided information about the number of messages sent by men and women in relation to their ages. OkCupid looked at different age ranges (e.g., 21-30-yrs-old, 31-40-yrs-old) and counted the number of messages sent by men and women from each age range.. Imagine that OkCupid provided us with the following data from one month (e.g., May 2016): The total number of messages sent for 50 men and 50 women from both of the following age groups; between 21-30-yrs-old and between 31-40-yrs old. We would then have data from 200 users of OkCupid.
Example 2 of 5
How many nominal independent variables are there?
Example 2 of 5
The then tells us to decide: What type of design is this?
Example 2 of 5
Based on the answers to these questions, what statistical analysis could be used to determine if there were significant differences in the number of messages sent among the four groups?
Example 3 of 5
Another interesting OkCupid finding concerned who was more likely to send a first message to another OkCupid member. OkCupid reported that the sender’s gender and sexual orientation had an impact on the likelihood of sending a first message, but only for male senders. That is, heterosexual men were more likely than gay men and bisexual men to send a first message to another member of OkCupid. However, that difference was not found among heterosexual women, lesbians, and bisexual women.
For this example, imagine that we recruited 30 heterosexual men, 30 gay men, and 30 bisexual men. We ask the men to rate, on a 7-point scale, the likelihood (1 = not very, 7 = very) that they would send the first message to another member from OkCupid.
Which statistical test could be used to determine if there was a significant difference in likelihood ratings among the three groups?
Now skip ahead to the next example by clicking here. Or, for more practice walking through the flowchart questions, simply click the Next button in the bottom right corner of the screen.
Example 3 of 5
In which of the following four categories does this situation fall? Click to see the data again. And click on the flowchart button to see the overview for choosing the best test.
Another interesting OkCupid finding concerned who was more likely to send a first message to another OkCupid member. OkCupid reported that the sender’s gender and sexual orientation had an impact on the likelihood of sending a first message, but for only male senders. That is, heterosexual men were more likely than gay men and bisexual men to send a first message to another member of OkCupid. However, that difference was not found among heterosexual women, lesbians, and bisexual women. For this example, imagine that we recruited 30 heterosexual men, 30 gay men, and 30 bisexual men. We ask the men to rate, on a 7-point scale, the likelihood (1 = not very, 7 = very) that they would send the first message to another member from OkCupid.
Example 3 of 5
How many nominal independent variables are there?
Example 3 of 5
How many levels does the independent variable have?
Example 3 of 5
What type of design is this?
Example 3 of 5
Based on the answers to these questions, what statistical analysis could be used to determine if there was a significant difference in likelihood ratings among the three groups?
Example 4 of 5
OkCupid also provided data indicating that if heterosexual women were interested in sending the first message to heterosexual men, the heterosexual women would perceive the heterosexual men’s attractiveness to be greater than their own attractiveness. That is, the heterosexual woman would be more likely to send the first message if she perceived the heterosexual man’s attractiveness to be greater than her attractiveness. Imagine that we recruited 120 heterosexual women and asked each to view two pictures of heterosexual men. The pictures were previously sorted for perceived attractiveness by each woman, which resulted in identifying two different pictures. One picture would be of a man perceived to be more attractive than the woman, and one picture would be of a man perceived to be less attractive than the woman. We then ask the woman to rate both pictures for the likelihood (1 = not very, 10 = very) she would send the first message to the man depicted in each picture.
Which statistical test could be used to determine if there was a significant difference in the likelihood ratings between the two groups?
Now skip ahead to the next example by clicking here. Or, for more practice walking through the flowchart questions, simply click the Next button in the bottom right corner of the screen.
Example 4 of 5
In which of the following four categories does this situation fall? Click to see the data again. And click on the flowchart button to see the overview for choosing the best test.
OkCupid also provided data indicating that if heterosexual women were interested in sending the first message to heterosexual men, the heterosexual women would perceive the heterosexual men’s attractiveness to be greater than their own attractiveness. That is, the heterosexual woman would be more likely to send the first message if she perceived the heterosexual man’s attractiveness to be greater than her attractiveness. Imagine that we recruited 120 heterosexual women and asked each to view two pictures of heterosexual men. The pictures were previously sorted for perceived attractiveness by each woman, which resulted in identifying two different pictures. One picture would be of a man perceived to be more attractive than the women, and one picture would be of a man perceived to be less attractive than the women. We then ask the women to rate both pictures for the likelihood (1 = not very, 10 = very) they would send the first message to the man depicted in each picture.
Example 4 of 5
How many nominal independent variables are there?
Example 4 of 5
How many levels does the independent variable have?
Example 4 of 5
How many samples are there?
Example 4 of 5
What type of design is this?
Example 4 of 5
Based on the answers to these questions, what statistical analysis could be used to determine if there was a significant difference in likelihood ratings between the two groups?
Example 5 of 5
Let’s look at one final research finding from OkCupid. We frequently do not send an immediate response to email messages; our email inboxes have an accumulation of messages waiting for our responses. The same is true when using online dating sites. OkCupid found that, for heterosexual men, the number of messages received had an impact on the probability they would respond to all of their messages. That is, the more messages in a person’s inbox without a response, the more likely the person would send a response to all of the messages. Imagine that we recruited 120 heterosexual men. We show each person three message inboxes containing different ranges of messages without a response: 20-39, 40-59, and 60-79. For each message inbox, we ask each man to rate the degree of probability (1 = low probability, 7 = high probability) that they would respond to all the messages within 48 hours.
Which statistical test could be used to determine if there was a significant difference in probability ratings among the three groups?
Now skip ahead to the end of the activity by clicking here. Or, for more practice walking through the flowchart questions, simply click the Next button in the bottom right corner of the screen.
Example 5 of 5
In which of the following four categories does this situation fall? Click to see the data again. And click on the flowchart button to see the overview for choosing the best test.
Let’s look at one final research finding from OkCupid. We frequently do not send an immediate response to email messages; our email inboxes have an accumulation of messages waiting for our responses. The same is true when using online dating sites. OkCupid found that, for heterosexual men, the number of messages received had an impact on the likelihood they would respond to all of their messages. That is, the more messages in a person’s inbox without a response, the more likely the person would send a response to all of the messages. Imagine that we recruited 120 heterosexual men. We show each person three message inboxes containing different ranges of messages without a response: 20-39, 40-59, and 60-79. For each message inbox, we ask each man to rate the degree of probability (1 = low probability, 7 = high probability) that they would respond to all the messages within 48 hours.
Example 5 of 5
How many nominal independent variables are there?
Example 5 of 5
How many levels does the independent variable have?
Example 5 of 5
What type of design is this?
Example 5 of 5
Based on the answers to these questions, what statistical analysis could be used to determine if there was a significant difference in probability ratings among the three groups?
14.1 Activity Completed!

Congratulations! You have completed the activity and gained some good experience in choosing the best hypothesis test.