Chapter 16. How to Improve Government Operations: Everything Up to Regression

Introduction

Which Test Is Best?
true
true
You must read each slide, and complete any questions on the slide, in sequence.

How to Improve Government Operations: Everything Up to Regression

By Warren Fass, University of Pittsburgh Bradford, and Susan A. Nolan, Seton Hall University

Appelbaum, B. (2015, September 29). Behaviorists show the U.S. how to improve government operations. https://www.nytimes.com/2015/09/30/business/behaviorists-show-the-us-how-to-improve-government-operations.html?smprod=nytcore-iphone&smid=nytcore-iphone-share&_r=0

Shu, L. L., Mazar, N., Gino, F., Ariely, D., & Bazerman, M. H. (2012). Signing at the beginning makes ethics salient and decreases dishonest self-reports in comparison to signing at the end. Proceedings of the National Academy of Sciences of the United States of America, 109, 15197-15200. doi: 10.1073/pnas.1209746109

Introduction

How to Improve Government Operations: Everything Up to Regression

US tax form 1040 with pen and calculator.
Robyn Mackenzie/Shutterstock

Behavioral scientists have assisted the United States government, as well as other governments, with developing new strategies for increasing the amount of tax money collected from delinquent taxpayers and companies. In this activity, we will consider the various findings from the article, “Behaviorists Show the U.S. How to Improve Government Operations” (Appelbaum, 2015).

Guidelines for choosing the appropriate hypothesis test

Choosing the Appropriate Hypothesis Test, Image Long Description

By asking the right questions about our variables and research design, we can choose the appropriate hypothesis test for our research.

Four Categories of Hypothesis Tests (IV = Independent variable; DV = dependent variable)

  • 1. Only scale variables
  • 1.1. Question about association
  • 1.1.1. Pearson correlation coefficient
  • 1.2. Question about prediction
  • 1.2.1. Regression
  • 2. Nominal IV; Scale DV
  • 2.1. One IV
  • 2.1.1. Two groups (levels)
  • 2.1.1.1. One represented by a sample, one by the population
  • 2.1.1.1.1. Mu and sigma known
  • 2.1.1.1.1.1. z test
  • 2.1.1.1.2. Only mu known
  • 2.1.1.1.2.1. Single-sample t-test
  • 2.1.1.2. Two samples
  • 2.1.1.2.1. Within-groups design
  • 2.1.1.2.1.1. Paired-samples t test
  • 2.1.1.2.2. Between-groups design
  • 2.1.1.2.2.1. Independent-samples t test
  • 2.1.2. Three or more groups (levels)
  • 2.1.2.1. Within-groups design
  • 2.1.2.1.1. One-way within-groups ANOVA
  • 2.1.2.2. Between-groups design
  • 2.1.2.2.1. One-way between groups ANOVA
  • 2.2. One-way between groups ANOVA
  • 2.2.1. Factorial ANOVA (e.g., two-way between-groups ANOVA)
  • 3. Only nominal variables
  • 3.1. One nominal variable
  • 3.1.1. Chi-square test for goodness of fit
  • 3.2. Two nominal variables
  • 3.2.1. Chi-square test for independence
  • 4. Any ordinal variables
  • 4.1. Two ordinal variables; question about association
  • 4.1.1. Spearman rank-order correlation coefficient
  • 4.2. Nominal IV and ordinal DV
  • 4.2.1. Within-groups design; two groups
  • 4.2.1.1. Wilcoxon signed-rank test
  • 4.2.2. Between-groups design
  • 4.2.2.1. Two groups
  • 4.2.2.1.1. Mann-Whitney U test
  • 4.2.2.2. Three or more groups
  • 4.2.2.2.1. Kruskal-Wallis H test
  • Example 1 of 6

    How to Improve Government Operations: Everything Up to Regression

    Does signing your name before, rather than after, completing a form change our behavior? Behavioral scientists suggested that the U.S. federal government change the location of the signature box on the form. The new form had the location of the signature box at the beginning of the form, instead of at the end (the usual location). People who signed first paid more delinquent tax money, on average, than people who signed at the end of the form.

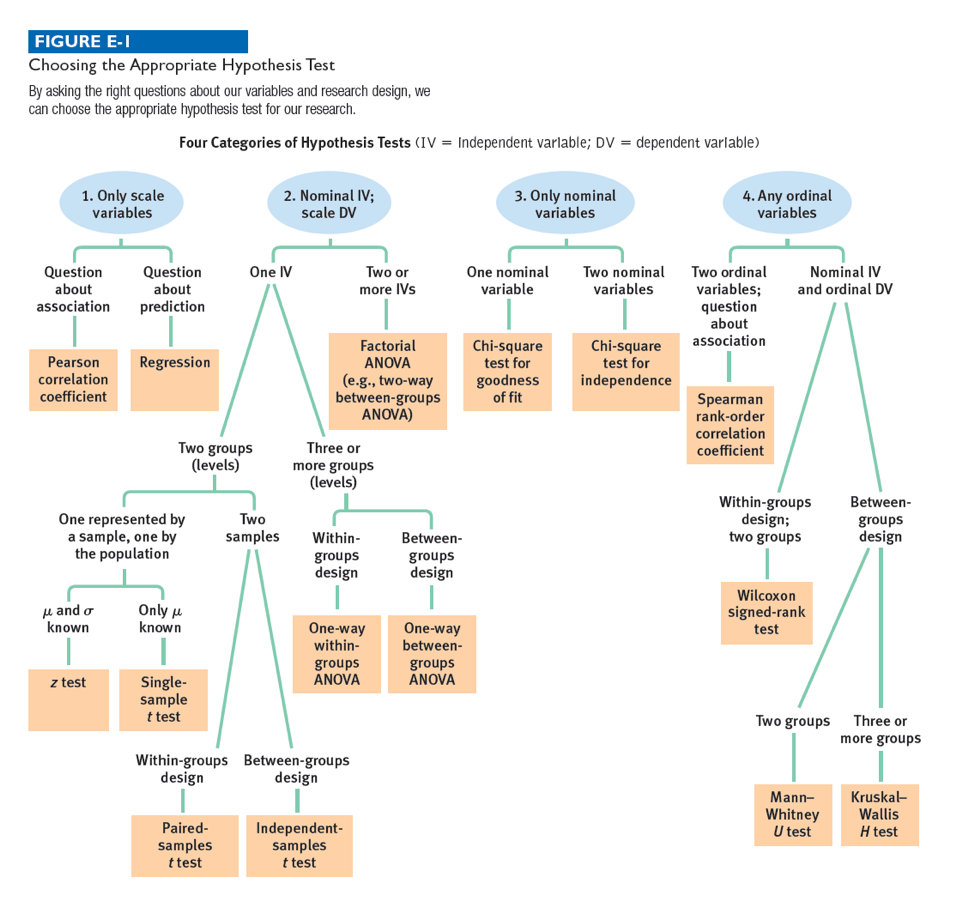
    Which statistical test could the researchers have used to identify this significant difference between the groups in the amount of delinquent tax money paid?

    Question

    9qagrXst2o9vuhx98YszPJHJ87ygTDE3/GOfqV6sQFqgqWB1yeQnmlO9XHR2nmxV4guiW43Dorw7W+pBRpMlbW9xFCA9V3aaP6ibVdUKZLofOONIR0Xje1VCwQEeWgpLhlCzfGj2+UDkhOdcr3MO6TLhIg3zcGkMQR6JgCn8vCHswBOiQxz7EPZ/eq4fRs+sCMwYZU2zC28CIWy+Y4dENonLpO5QKbfSHz+3a/6PQTDgTS5cKOe9I+x6mh7PH6rqIr7E1UUY5SDodyjII/mtJ8EbE7VZ9dOLxPTBNHb6ki597EcxTbvM3m/hhwpGRNhwBld/SkjGMywO/sWRcb/S28PMWB+xgnA8ZByu0wPvUt34oCD1QU4Rk7agp1C16d1efft1ZwPKzCbKz14q
    Correct! The researchers could have used an independent-samples t test because there is one nominal independent variable, signature location, with two levels or groups: beginning and end. There is a scale dependent variable, amount of money. And participants are only in one of the two groups, so it is a between-groups design.
     
    Now skip ahead to the next example by clicking here. Or, for more practice walking through the flowchart questions, simply click the Next button in the bottom right corner of the screen.
    Actually, that’s not the correct statistical analysis. Let’s walk through the questions on the flowchart in Appendix E to determine what analysis could be used in this case.

    Example 1 of 6

    How to Improve Government Operations: Everything Up to Regression

    In which of the following four categories does this situation fall? Click to see the data again. And click on the flowchart button to see the overview for choosing the best test.

    Question

    sk97pNhgnDdS8cMuwHIcNGkOQu8zhZMruu2u88fM0qGdW97cS4aHwZRZbj0MaoIISfOaTTPjzGWg1FzVajDZage/lPkk+YotrDyrM4QRuYSjUH7OQ2HACIQv/DswADhdI5A+huzRe13qreW2Z1Br7AMENdjNksgE7me7mwahmFhtkzVYuVwBFlOiJ9OZW5vUlsPBQYcLL3jLqBfNxdCDJ0EbNFFxH5eS1bf2GZ8sMwV6K6EIQ4ef/XW9nyNdS1iE2U6c0LtvlZs=
    Correct! There is at least one nominal independent variable, and a scale dependent variable.
    Actually, there is at least one nominal independent variable, and a scale dependent variable.

    Example 1 of 6

    How to Improve Government Operations: Everything Up to Regression

    How many nominal independent variables are there?

    Question

    2kRKO2tGsk8m2tCvHzICmw77wO4Rqt2r4LHtUfKnQzc5IktF/TNe7FwE43Yf7Tg2A/4OcU6+2J5DyBGx4ZoLv9YG8iVhnFlmA8O3ZrTcjPk=
    Correct! There is one nominal independent variable, signature location. (The dependent variable, amount of money, is scale.)
    Actually, there is one nominal independent variable, signature location. (The dependent variable, amount of money, is scale.)

    Example 1 of 6

    How to Improve Government Operations: Everything Up to Regression

    How many levels does the independent variable have?

    Question

    Mo2sQ1oCUhznV+GnK8Wf81khqMWDU6hRlouB3iPgqhGwNqp8hV5Xo2x5F8H4dQW44S93hes84sOVhvoga+5CnZv5lto=
    Correct! There are two levels or groups, beginning and end.
    Actually, there are two levels or groups, beginning and end.

    Example 1 of 6

    How to Improve Government Operations: Everything Up to Regression

    How many samples are there?

    Question

    erSrES0ZAKOTuDVIOkPYxo68vABJGDaUDXG6TmSIRkLosxO6LJX5akrQUQ0rEiotwDB3vhjEbWAnDNb8Ym+vlk3W3Cgp99rCvSXF1j7D9Odq2PTFPriRGfn1CyHSGVpFnDibDyZQo6o8DkbWaY85rZeLSiabcqypOzYupdwx3rUVpNJt
    Correct! There are two samples, one consisting of people completing forms with the signature box at the beginning and one consisting of people completing forms with the signature box at the end.
    Actually, there are two samples, one consisting of people completing forms with the signature box at the beginning and one consisting of people completing forms with the signature box at the end.

    Example 1 of 6

    How to Improve Government Operations: Everything Up to Regression

    What type of design is this?

    Question

    k5gfwlifhUJcajKPDYPy7aXBa2aHyzwx/UO795ojOcNz+53Tt0mf3xcM0Nm5g8cOaYpjbioWobo5Lcuf5tNpzQ==
    Correct! This is a between-groups design. Each participant appears in only one of the two groups.
    Actually, this is a between-groups design. Each participant appears in only one of the two groups.

    Example 1 of 6

    How to Improve Government Operations: Everything Up to Regression

    Based on the answers to these questions, which statistical test could be used to determine if there was a significant difference between the two groups in the amount of delinquent tax money paid?

    Question

    9qagrXst2o9vuhx98YszPJHJ87ygTDE3/GOfqV6sQFqgqWB1yeQnmlO9XHR2nmxV4guiW43Dorw7W+pBRpMlbW9xFCA9V3aaP6ibVdUKZLofOONIR0Xje1VCwQEeWgpLhlCzfGj2+UDkhOdcr3MO6TLhIg3zcGkMQR6JgCn8vCHswBOiQxz7EPZ/eq4fRs+sCMwYZU2zC28CIWy+Y4dENonLpO5QKbfSHz+3a/6PQTDgTS5cKOe9I+x6mh7PH6rqIr7E1UUY5SDodyjII/mtJ8EbE7VZ9dOLxPTBNHb6ki597EcxTbvM3m/hhwpGRNhwBld/SkjGMywO/sWRcb/S28PMWB+xgnA8ZByu0wPvUt34oCD1QU4Rk7agp1C16d1efft1ZwPKzCbKz14q
    Correct! The researchers could have used the independent-samples t test because there is one nominal independent variable, signature location, with two levels or groups, beginning and end. There is a scale dependent variable, amount of money. And participants are only in one of the two groups, so it is a between-groups design.
    Actually, that’s not the correct statistical analysis. The researchers could have used the independent-samples t test because there is one nominal independent variable, signature location, with two levels or groups, beginning and end. There is a scale dependent variable, amount of money. And participants are only in one of the two groups, so it is a between-groups design.

    Example 2 of 6

    How to Improve Government Operations: Everything Up to Regression

    What is the long-term financial impact related to the use of the new tax forms? One researcher reported that after the first year the new form was in use, the federal government increased revenue by about 6% compared to the year before use of the new form (Appelbaum, 2015). Would the use of the new form continue to show increases in revenue in future years from the preceding tax years? Let’s assume we have the following data from fifteen different tax years: the percentage of tax forms that have the signature on top submitted during each tax year and the percentage change (from the previous tax year) in revenue collected by the federal government.

    Which statistical test could be used to predict the percentage change in revenue based upon the number of new tax forms submitted?

    Question

    3cBAK0NOPJ0easBQM9ZrMLCgVFglnuaS/AFlPC8Fnm7PYxAQrfEUvbZI6vQ3sAWmgbzKRpWjnnfBwJOwnFDASHkVuqDK1AmeppMWODT7lZZ+KmtYSlHTvenlOfVcpzZG1BK4s5dQ9tCjtiPkBaAoJ8z33Jr7uD8hsJvI28M19ocF5rsBCupDNpGL4jcncID+pWVPw+wGPTl1ml9o+oZTgINWlMLjOzRYO7Zlu8j3uH6zOZsB7mTVHr/EEtlf7QsRk8v0S1JJ+6PZXs4XwrgnpGr2R12BKjTR9az9tYKvXWLtgFJwiVsQTpBqAGVtcy0qAyIfmPSdPg8ntmrXJDhFmRbqNfFaUzms+rXRZNhvngCy0+NnUNz+mnv7gat3EUDTDMQEvwbFNp/1ipQ9
    Correct! The researchers could have used regression because there are only scale variables. The first scale variable is the percentage of tax forms submitted that have the signature on top, and the second scale variable is percent change in revenue. The question is about prediction rather than association.
     
    Now skip ahead to the next example by clicking here. Or, for more practice walking through the flowchart questions, simply click the Next button in the bottom right corner of the screen.
    That’s not the correct statistical analysis. Let’s walk through the questions on the flowchart in Appendix E to determine what analysis could be used in this case.

    Example 2 of 6

    How to Improve Government Operations: Everything Up to Regression

    In which of the following four categories does this situation fall? Click to see the data again. And click on the flowchart to see the overview for choosing the best test.

    Question

    WVcGaznk0lpyp4XvlZqHzj3i6rO90Pp+/9xdySp+406/6UHRFtH9YKp6vTxJR2HewGy2K4Bz1cVFpPv4aEAL5zPUFbjbK5h+gvu1mXw5jsqzoarTRSk7VWBHh8KlJfCSDU8JELjK1hfgcQ8ZBlxX9vKMm8L8bJj4IBIhFAOnoNPQwTz02EiufjzzqaGZwA2emxSpZNvZgVoC9GrEeFLHHBqzTHaEN9P+bpNx7x6XsiQA6RFyaxtOE6n/atF4LmwBxncoth3p4h8=
    Correct! There are only scale variables – percentage of tax forms submitted that have the signature on top and percent change in revenue.
    Actually, there are only scale variables – percentage of tax forms submitted that have the signature on top and percent change in revenue.

    Example 2 of 6

    How to Improve Government Operations: Everything Up to Regression

    Is the research question about association or prediction?

    Question

    ANMF/hiVeoqA1RDRbNgpmCeF6RQ3mihfevv75UaTt58kyTcvWbiBwM1mykbMtf+qGDDjyiaCF46F6SdL
    Correct! The research question is about prediction. We want to know if percentage of tax forms submitted that have the signature on top predicts percent change in revenue, not only whether the two variables are related.
    Actually, the research question is about prediction. We want to know if percentage of tax forms submitted that have the signature on top predicts percent change in revenue, not only whether the two variables are related.

    Example 2 of 6

    How to Improve Government Operations: Everything Up to Regression

    Based on the answers to these questions, which statistical test could be used to predict the percentage change in revenue based on the percentage of tax forms submitted that have the signature on top?

    Question

    3cBAK0NOPJ0easBQM9ZrMLCgVFglnuaS/AFlPC8Fnm7PYxAQrfEUvbZI6vQ3sAWmgbzKRpWjnnfBwJOwnFDASHkVuqDK1AmeppMWODT7lZZ+KmtYSlHTvenlOfVcpzZG1BK4s5dQ9tCjtiPkBaAoJ8z33Jr7uD8hsJvI28M19ocF5rsBCupDNpGL4jcncID+pWVPw+wGPTl1ml9o+oZTgINWlMLjOzRYO7Zlu8j3uH6zOZsB7mTVHr/EEtlf7QsRk8v0S1JJ+6PZXs4XwrgnpGr2R12BKjTR9az9tYKvXWLtgFJwiVsQTpBqAGVtcy0qAyIfmPSdPg8ntmrXJDhFmRbqNfFaUzms+rXRZNhvngCy0+NnUNz+mnv7gat3EUDTDMQEvwbFNp/1ipQ9
    Correct! The researchers could have used regression because there are only scale variables. The first scale variable is the percentage of tax forms submitted that have the signature on top, and the second scale variable is percent change in revenue. The question is about prediction rather than association.
    Actually, that’s not the correct statistical analysis. The researchers could have used regression because there are only scale variables. The first scale variable is the percentage of tax forms submitted that have the signature on top, and the second scale variable is percent change in revenue. The question is about prediction rather than association.

    Example 3 of 6

    How to Improve Government Operations: Everything Up to Regression

    The British government found it could increase collections from delinquent taxpayers by creating a social norm. They told delinquent taxpayers that nine in 10 neighbors had paid their taxes (Appelbaum, 2015). Imagine that we recruited 160 adults, and randomly assigned them to read one of three different descriptions about a delinquent taxpayer: The first group’s description would contain information that 10% of neighbors had paid their taxes (so, 90% delinquent taxpayers); the second group’s description would contain a statement that 50% of neighbors had paid their taxes (so, 50% delinquent taxpayers); and, the third group’s description would contain a statement that 90% of neighbors had paid their taxes (so, 10% delinquent taxpayers).

    What statistical analysis could be used to determine whether there was a significant difference among the ratings from the three groups?

    Question

    VGZ05Zl57vMLBxezGGW/rjTsitHC2pSSgwnQPL3fS9F46cp8f138gVyI6SRVo1s8YK1qI1nIxfMQCajH+dlbGGK+Mlh7MTct71jjrYpDhl8bui+ww1TYXXKo9mi4pCFnxUAfKfLw6KQY41A7n3orqKjnDcDSm5KdXqm+DEqw6LQjipsQl0LI52p/WyCtdVZxXyz2ei2P9JNFC3mSvPACV6ltlAmEA5zp6Abn8cMRylzMHK9jJU3PIMGhrT2zqxi32w/y/n9VYu01rWYo9bvASs1GCbANvrfbmdrJew80/j58BiulYFh/hbCYve0rdkhZhWHyIdO8SKOYgPpKuDjNf3VIRaDoI9nFaYd962V0FTh+1xDkNnzcqrSvrXHR4+w5KhH8IuVwVFH6yzCR
    Correct! The researchers could have used a one-way between-groups ANOVA because there is one nominal independent variable, percentage of neighbors who paid their taxes, with three levels or groups: 10%, 50%, and 90%. There is a scale dependent variable, a rating of the likelihood of paying taxes. And the participants are in only one of the three groups, so it is a between-groups design.
     
    Now skip ahead to the next example by clicking here. Or, for more practice walking through the flowchart questions, simply click the Next button in the bottom right corner of the screen.
    That’s not the correct statistical analysis. Let’s walk through the questions on the flowchart in Appendix E to determine what analysis could be used in this case.

    Example 3 of 6

    How to Improve Government Operations: Everything Up to Regression

    In which of the following four categories does this situation fall? Click to see the data again. And click on the flowchart to see the overview for choosing the best test.

    Question

    sk97pNhgnDdS8cMuwHIcNGkOQu8zhZMruu2u88fM0qGdW97cS4aHwZRZbj0MaoIISfOaTTPjzGWg1FzVajDZage/lPkk+YotrDyrM4QRuYSjUH7OQ2HACIQv/DswADhdI5A+huzRe13qreW2Z1Br7AMENdjNksgE7me7mwahmFhtkzVYuVwBFlOiJ9OZW5vUlsPBQYcLL3jLqBfNxdCDJ0EbNFFxH5eS1bf2GZ8sMwV6K6EIQ4ef/XW9nyNdS1iE2U6c0LtvlZs=
    Correct! There is at least one nominal independent variable and a scale dependent variable.
    Actually, there is at least one nominal independent variable and a scale dependent variable.

    Example 3 of 6

    How to Improve Government Operations: Everything Up to Regression

    How many nominal independent variables are there?

    Question

    Q/Akfrz/Qz13c1iia8RuB7BeUIbXiznSo1NNai0VR8qmpJfvVlqVP27jevCpjgCDm8TkDdykb5M1S/VixN6aB3xHZ1nWsgEVBEMob+G6Aok=
    Correct! There is one nominal independent variable, percentage of neighbors who paid their taxes. (The dependent variable, likelihood of paying taxes rating, is scale.)
    Actually, there is one nominal independent variable, percentage of neighbors who paid their taxes. (The dependent variable, likelihood of paying taxes rating, is scale.)

    Example 3 of 6

    How to Improve Government Operations: Everything Up to Regression

    How many levels does the independent variable have?

    Question

    wnSZBa1X0EKJqbfzYFcuU+V/nmHMI9lEK976xH3Zj8ewTKMy2e9EsnS+jIZvg0f2bCSuU7yXujS22rTT2Fkz/7tDg6I=
    Correct! There are three levels or groups: 10%, 50%, 90%.
    Actually, there are three levels or groups: 10%, 50%, 90%.

    Example 3 of 6

    How to Improve Government Operations: Everything Up to Regression

    What type of design is this?

    Question

    k5gfwlifhUJcajKPDYPy7aXBa2aHyzwx/UO795ojOcNz+53Tt0mf3xcM0Nm5g8cOaYpjbioWobo5Lcuf5tNpzQ==
    Correct! This is a between-groups design. Each participant is only in one of the three groups.
    Actually, this is a between-groups design. Each participant is only in one of the three groups.

    Example 3 of 6

    How to Improve Government Operations: Everything Up to Regression

    Based on the answers to these questions, which statistical analysis could be used to determine whether there was a significant difference among the ratings from the three groups?

    Question

    VGZ05Zl57vMLBxezGGW/rjTsitHC2pSSgwnQPL3fS9F46cp8f138gVyI6SRVo1s8YK1qI1nIxfMQCajH+dlbGGK+Mlh7MTct71jjrYpDhl8bui+ww1TYXXKo9mi4pCFnxUAfKfLw6KQY41A7n3orqKjnDcDSm5KdXqm+DEqw6LQjipsQl0LI52p/WyCtdVZxXyz2ei2P9JNFC3mSvPACV6ltlAmEA5zp6Abn8cMRylzMHK9jJU3PIMGhrT2zqxi32w/y/n9VYu01rWYo9bvASs1GCbANvrfbmdrJew80/j58BiulYFh/hbCYve0rdkhZhWHyIdO8SKOYgPpKuDjNf3VIRaDoI9nFaYd962V0FTh+1xDkNnzcqrSvrXHR4+w5KhH8IuVwVFH6yzCR
    Correct! The researchers could have used a one-way between-groups ANOVA because there is one nominal independent variable, percentage of neighbors who paid their taxes, with three levels or groups: 10%, 50%, and 90%. There is a scale dependent variable, rating of the likelihood of paying taxes. And the participants are only in one of the three groups, so it is a between-groups design.
    Actually, that’s not the correct statistical analysis. The researchers could have used a one-way between-groups ANOVA because there is one nominal independent variable, percentage of neighbors who paid their taxes, with three levels or groups: 10%, 50%, and 90%. There is a scale dependent variable, rating of the likelihood of paying taxes. And the participants are only in one of the three groups, so it is a between-groups design.

    Example 4 of 6

    How to Improve Government Operations: Everything Up to Regression

    Several years ago, the British government decided to change how they sent warning notices to people who had not registered their vehicles (Appelbaum, 2015). Instead of sending only the standard warning message that the person’s car could be taken anyway, the British government decided to send a picture of the person’s car along with the standard warning message. And the British government found that “people who had not registered their vehicles were more likely to do so” as a result of the new method. However, the finding did not take into consideration the gender of the individuals who had failed to register their cars. Imagine that we recruited 80 men and 80 women to participate in the study. We assign one group of 40 men and one group of 40 women to pretend that they received a warning notice that their unregistered car will be taken away unless they register it within two weeks. We also assign the remaining 40 men and 40 women to pretend that they received the identical warning message but with a picture of their own car that researchers had acquired in advance. Then we ask all participants to rate, on a 10-point scale, the likelihood (1 = not very, 10 = very) that they would register their car within two weeks from receiving the notice.

    Which statistical test could be used to determine if there were significant differences in ratings among the four groups?

    Question

    IzwqNgyJwPxT+0HTuJg9tuw5+A5pY6VxIfQDTVe3z6n09TEQz+09z5ZQLZTfjqNAVGIxhCyX+H+XMavaX5KPTIr/Rannv1uQoVpi/1y9wIhqWXujIihjsYsClV0638LPAZqYQh67x5WA8X6il/vcj+FEG19Zv+bYQCbDDavCH5jcpAU5lOzNKyEr7GV3MppNDHLgcxI+MHEeCSRxbVZ0cWK43WNa59BsYz50tIwBTADv4tYroSNoqDF1TWzHLe0u0F11VqQtGXFFf+eB9THCzGFabz7WpyZ4c8U799WrbpufeIv3626n7JK0ElNDZMgjUknNpC0Re95nrUzjiMMaL8stin3fM30XsZ5aBQ2iFk62DryDhQKjhy7Dp9BkmPH7JxTZTJkX0bYSQZAT
    Correct! The researchers could have used a two-way between-groups ANOVA, because there are two nominal independent variables, gender, with two levels or groups, men and women; and type of warning, with two levels or groups, with picture and without picture. There is a scale dependent variable, likelihood ratings. And participants are only in one of the four groups, so it is a between-groups design.
     
    Now skip ahead to the next example by clicking here. Or, for more practice walking through the flowchart questions, simply click the Next button in the bottom right corner of the screen.
    Actually, that’s not the correct statistical analysis. Let’s walk through the questions on the flowchart in Appendix E to determine what analysis could be used in this case.

    Example 4 of 6

    How to Improve Government Operations: Everything Up to Regression

    In which of the following four categories does this situation fall? Click to see the data again. And click on the flowchart to see the overview for choosing the best test.

    Question

    sk97pNhgnDdS8cMuwHIcNGkOQu8zhZMruu2u88fM0qGdW97cS4aHwZRZbj0MaoIISfOaTTPjzGWg1FzVajDZage/lPkk+YotrDyrM4QRuYSjUH7OQ2HACIQv/DswADhdI5A+huzRe13qreW2Z1Br7AMENdjNksgE7me7mwahmFhtkzVYuVwBFlOiJ9OZW5vUlsPBQYcLL3jLqBfNxdCDJ0EbNFFxH5eS1bf2GZ8sMwV6K6EIQ4ef/XW9nyNdS1iE2U6c0LtvlZs=
    Correct! There is at least one nominal independent variable and a scale dependent variable.
    Actually, there is at least one nominal independent variable and a scale dependent variable.

    Example 4 of 6

    How to Improve Government Operations: Everything Up to Regression

    How many nominal independent variables are there?

    Question

    djN4cxNFGiYY3B4VHSiTnVi9NldFJbOWXubSHFtzFSQNo6icO26MH5S0ClbCstCoRP3E7gZ/ib/jiUluTkQI/gqseto3QVeI7ZDjW4WTL7w=
    Correct! There are two nominal independent variables, gender and type of warning. (The dependent variable, likelihood ratings, is scale.) At this point, the flowchart tells us that we should use some kind of a factorial ANOVA. Appendix E directs us to the first table in the chapter on two-way between-groups ANOVA for further instructions. In the first column, it tells us that this is a two-way ANOVA because there are two nominal independent variables.
    Actually, there are two nominal independent variables, gender and type of warning. (The dependent variable, likelihood ratings, is scale.) At this point, the flowchart tells us that we should use some kind of a factorial ANOVA. Appendix E directs us to the first table in the chapter on two-way between-groups ANOVA for further instructions. In the first column, it tells us that this is a two-way ANOVA because there are two nominal independent variables.

    Example 4 of 6

    How to Improve Government Operations: Everything Up to Regression

    The then tells us to decide: What type of design is this?

    Question

    k5gfwlifhUJcajKPDYPy7aXBa2aHyzwx/UO795ojOcNz+53Tt0mf3xcM0Nm5g8cOaYpjbioWobo5Lcuf5tNpzQ==
    Correct! Each participant appears in only one of the four groups, so it is a between-groups design.
    Actually, each participant appears in only one of the four groups, so it is a between-groups design.

    Example 4 of 6

    How to Improve Government Operations: Everything Up to Regression

    Based on the answers to these questions, what statistical analysis could be used to determine if there were significant differences in the likelihood ratings among the four groups?

    Question

    IzwqNgyJwPxT+0HTuJg9tuw5+A5pY6VxIfQDTVe3z6n09TEQz+09z5ZQLZTfjqNAVGIxhCyX+H+XMavaX5KPTIr/Rannv1uQoVpi/1y9wIhqWXujIihjsYsClV0638LPAZqYQh67x5WA8X6il/vcj+FEG19Zv+bYQCbDDavCH5jcpAU5lOzNKyEr7GV3MppNDHLgcxI+MHEeCSRxbVZ0cWK43WNa59BsYz50tIwBTADv4tYroSNoqDF1TWzHLe0u0F11VqQtGXFFf+eB9THCzGFabz7WpyZ4c8U799WrbpufeIv3626n7JK0ElNDZMgjUknNpC0Re95nrUzjiMMaL8stin3fM30XsZ5aBQ2iFk62DryDhQKjhy7Dp9BkmPH7JxTZTJkX0bYSQZAT
    Correct! The researchers could have used a two-way between-groups ANOVA, because there are two nominal independent variables, gender, with two levels or groups, men and women; and type of warning, with two levels or groups, with picture and without picture. There is a scale dependent variable, likelihood ratings. And participants are only in one of the four groups, so it is a between-groups design.
    Actually, that’s not the correct statistical analysis. The researchers could have used a two-way between-groups ANOVA, because there are two nominal independent variables, gender, with two levels or groups, men and women: and type of warning, with two levels or groups, with picture and without picture. There is a scale dependent variable, likelihood ratings. And participants are only in one of the four groups, so it is a between-groups design.

    Example 5 of 6

    How to Improve Government Operations: Everything Up to Regression

    Let’s look again at whether signing your name before completing a form changes behavior – in this case, does it make people more honest? Auto insurance companies hope that customers are honestly reporting how many miles they drive each year on their insurance renewal forms. If the number of miles driven annually impacts the insurance premium, some people may report driving fewer miles hoping to have a smaller increase in their yearly premiums. Researchers have explored whether changing the location of customers’ signature – from the usual location at the bottom of the form to the top of the form – might result in more accurate reporting (Shu, Mazar, Gino, Ariely, & Bazerman, 2012). Specifically, would customers who signed the form at the top report driving more miles, on average, than customers who signed the form at the bottom? Such a finding would imply that the customers signing at the top were being honest because their insurance premiums would have been lower if they reported driving fewer miles. Imagine that we obtained permission from an auto insurance company to randomly select 5000 of their customers whose policy was set for renewal. We then randomly assign the customers to one of the following renewal form conditions: One half of the customers would be sent the renewal form with the signature box at the bottom of the form (the usual location), and the other one half of the customers would be sent the renewal form with the signature box located at the top of the form. All other information on each form would be identical. Each customer must indicate the number of miles driven from the previous year’s renewal to the date on the renewal form.

    Which statistical test could the researchers have used to determine if there was a significant difference between the groups in the number of miles reported?

    Question

    zBoN2uHjuWcZuL180/f7ozzgb0hTDr7wPKGygau5Cj0LP4Xuj1aBPEfbxBN71cs2TrxOp4F3hGPBKpWEMcwvmDm9tXQqi9ubSBEAc5ogOiUQlDSPOFCkzu9jCyakBiSYqtFsqvXX/O5w4DECLkxnCQm1ezKdgBqn/Pw1tFMf1EN1lDnq+cpujVXM3NVaT/u4J2PJWFmNJunJFDP27uutqQnOLDM5r/6qNwED5N2kgm7Czr0OSwX09sKQws6kOOll/V9kcEno+27b2Xo6UTfQ7/RVoNvwr4voSNxts0H2fY+HRPq25yX7k73awRNVidn/0heYM+i3vsK4EwSpCd0auXiU+t3Bk5HYYbl2xv6NxnlH7UbXaj9fsNy70pkR1wC45rA6JpZZzVbIl0Ox
    Correct! The researchers could have used an independent-samples t test because there is one nominal independent variable, signature location, with two levels or groups: top and bottom. There is a scale dependent variable, number of miles. And participants (customers) are only in one of the two groups, so it is a between-groups design.
     
    Now skip ahead to the next example by clicking here. Or, for more practice walking through the flowchart questions, simply click the Next button in the bottom right corner of the screen.
    That’s not the correct statistical analysis. Let’s walk through the questions on the flowchart in Appendix E to determine what analysis could be used in this case.

    Example 5 of 6

    How to Improve Government Operations: Everything Up to Regression

    In which of the following four categories does this situation fall? Click to see the data again. And click on the flowchart to see the overview for choosing the best test.

    Question

    sk97pNhgnDdS8cMuwHIcNGkOQu8zhZMruu2u88fM0qGdW97cS4aHwZRZbj0MaoIISfOaTTPjzGWg1FzVajDZage/lPkk+YotrDyrM4QRuYSjUH7OQ2HACIQv/DswADhdI5A+huzRe13qreW2Z1Br7AMENdjNksgE7me7mwahmFhtkzVYuVwBFlOiJ9OZW5vUlsPBQYcLL3jLqBfNxdCDJ0EbNFFxH5eS1bf2GZ8sMwV6K6EIQ4ef/XW9nyNdS1iE2U6c0LtvlZs=
    Correct! There is at least one nominal independent variable, and a scale dependent variable.
    Actually, there is at least one nominal independent variable, and a scale dependent variable.

    Example 5 of 6

    How to Improve Government Operations: Everything Up to Regression

    How many nominal independent variables are there?

    Question

    Q/Akfrz/Qz13c1iia8RuB7BeUIbXiznSo1NNai0VR8qmpJfvVlqVP27jevCpjgCDm8TkDdykb5M1S/VixN6aB3xHZ1nWsgEVBEMob+G6Aok=
    Correct! There is one nominal independent variable, signature location. (The dependent variable, number of miles, is scale.)
    Actually, there is one nominal independent variable, signature location. (The dependent variable, number of miles, is scale.)

    Example 5 of 6

    How to Improve Government Operations: Everything Up to Regression

    How many levels does the independent variable have?

    Question

    Mo2sQ1oCUhznV+GnK8Wf81khqMWDU6hRlouB3iPgqhGwNqp8hV5Xo2x5F8H4dQW44S93hes84sOVhvoga+5CnZv5lto=
    Correct! There are two levels or groups, top and bottom.
    Actually, there are two levels or groups, top and bottom.

    Example 5 of 6

    How to Improve Government Operations: Everything Up to Regression

    How many samples are there?

    Question

    kD14cNVWqyJi69ZWgn8edxVHnSrt1vwJh9Z0NdKAdLn+hkN6NIPRft5ESAAU6xeY/q+fmAZ198oBEYw1xeK5UFAb06KGlHeKk+bbeu0zRy0TTf+x0dnAUC054mWUnCIngkjUSA13MUCGg9L1mQMa8KrpT9ceb1wt9rkgozi2F88=
    Correct! There are two samples, one consisting of customers completing renewal forms with the signature box at the top and one consisting of customers completing renewal forms with the signature box at the bottom.
    Actually, there are two samples, one consisting of customers completing renewal forms with the signature box at the top and one consisting of customers completing renewal forms with the signature box at the bottom.

    Example 5 of 6

    How to Improve Government Operations: Everything Up to Regression

    What type of design is this?

    Question

    k5gfwlifhUJcajKPDYPy7aXBa2aHyzwx/UO795ojOcNz+53Tt0mf3xcM0Nm5g8cOaYpjbioWobo5Lcuf5tNpzQ==
    Correct! This is a between-groups design. Each participant (customer) appears in only one of the two groups.
    Actually, this is a between-groups design. Each participant (customer) appears in only one of the two groups.

    Example 5 of 6

    How to Improve Government Operations: Everything Up to Regression

    Which statistical test could the researchers have used to determine if there was a significant difference between the groups in the number of miles reported?

    Question

    9qagrXst2o9vuhx98YszPJHJ87ygTDE3/GOfqV6sQFqgqWB1yeQnmlO9XHR2nmxV4guiW43Dorw7W+pBRpMlbW9xFCA9V3aaP6ibVdUKZLofOONIR0Xje1VCwQEeWgpLhlCzfGj2+UDkhOdcr3MO6TLhIg3zcGkMQR6JgCn8vCHswBOiQxz7EPZ/eq4fRs+sCMwYZU2zC28CIWy+Y4dENonLpO5QKbfSHz+3a/6PQTDgTS5cKOe9I+x6mh7PH6rqIr7E1UUY5SDodyjII/mtJ8EbE7VZ9dOLxPTBNHb6ki597EcxTbvM3m/hhwpGRNhwBld/SkjGMywO/sWRcb/S28PMWB+xgnA8ZByu0wPvUt34oCD1QU4Rk7agp1C16d1efft1ZwPKzCbKz14q
    Correct! The researchers could have used an independent-samples t test because there is one nominal independent variable, signature location, with two levels or groups, top and bottom. There is a scale dependent variable, number of miles driven. And participants (customers) are only in one of the two groups, so it is a between-groups design.
    Actually, that’s not the correct statistical analysis. The researchers could have used an independent-samples t test because there is one nominal independent variable, signature location, with two levels or groups, top and bottom. There is a scale dependent variable, number of miles. And participants (customers) are only in one of the two groups, so it is a between-groups design.

    Example 6 of 6

    How to Improve Government Operations: Everything Up to Regression

    We will look at one more finding reported by Appelbaum (2015). In 2006, a U.S. federal law “made it easier for companies to enroll workers in retirement plans by default.” In general, that change resulted in an increase in the number of people enrolling in a retirement plan, but reduced the average amount of money people saved (contributed) toward retirement. That is, the employees who were enrolled by default, contributed, on average, the default percentage which was less than the average percentage for employees who self-enrolled. Imagine that we obtained from a company the percentage of salary contributions toward retirement for all employees during the 5 years prior to the default enrollment plan. We find that mean percentage contributed toward retirement to be 7.45. We then obtain the percentage of salary contributions for a sample of 200 employees who were enrolled in the retirement plan by default, and find the mean percentage contributed for that sample is 6.79, with a standard deviation of 1.14.

    What statistical analysis could you use to determine whether the 200 employees had a significantly different percentage contribution, on average, than all employees from the previous 5 years?

    Question

    z3M9jAUHU3bYCdO82DcoGGgQ/Wm2l2MYJwz55tsh4QIuKhALDk8jNfO02eMbNcbXda3yiIorv0N1KfKJ9hB+CJ3PQyc/oM9ZnmJ0Xov4/ZoSi3RnfheGSZ8gUnNyhOCJd9/fok77YDKnuJdF1I+LI3jHo+EEp15TBUrSsoohKWwZyODxIOiz1OtHUjaLCNEa8P/QeiomlVi88Zpo48Ya5//VigUdJsUzNPdBZI1uIV4SH/1Tpnw75alnDrfYAzGuNSIMrpiFrO/SiiG+iUP/ifl5Gex1Nu8JDqpA3Z18yzHG6W6shj0LdMu5qPHxc0Q/mRCb4a8v3C5x9Hc0AxpuAZHh6CQb9Hnmp/WjbfQt45ccNJ4Hl11Aa5FCWlz3u5QyYtJ3noJQpcPaFn5p
    Correct! The researchers could have used a single-sample t test because there is one nominal independent variable, retirement plan. There are two levels or groups: enrolled by default and self-enrolled. The former is represented by a sample and the latter by a population. There is a scale dependent variable, percentage contributed, and we know the population mean, but not the population standard deviation.
     
    Now skip ahead to the end of the activity by clicking here. Or, for more practice walking through the flowchart questions, simply click the Next button in the bottom right corner of the screen.
    Actually, that’s not the correct statistical analysis. Let’s walk through the questions on the flowchart in Appendix E to determine what analysis could be used in this case.

    Example 6 of 6

    How to Improve Government Operations: Everything Up to Regression

    In which of the following four categories does this situation fall? Click to see the data again. And click on the flowchart button to see the overview for choosing the best test.

    Question

    sk97pNhgnDdS8cMuwHIcNGkOQu8zhZMruu2u88fM0qGdW97cS4aHwZRZbj0MaoIISfOaTTPjzGWg1FzVajDZage/lPkk+YotrDyrM4QRuYSjUH7OQ2HACIQv/DswADhdI5A+huzRe13qreW2Z1Br7AMENdjNksgE7me7mwahmFhtkzVYuVwBFlOiJ9OZW5vUlsPBQYcLL3jLqBfNxdCDJ0EbNFFxH5eS1bf2GZ8sMwV6K6EIQ4ef/XW9nyNdS1iE2U6c0LtvlZs=
    Correct! There is at least one nominal independent variable, and a scale dependent variable.
    Actually, there is at least one nominal independent variable and a scale dependent variable.

    Example 6 of 6

    How to Improve Government Operations: Everything Up to Regression

    How many nominal independent variables are there?

    Question

    2kRKO2tGsk8m2tCvHzICmw77wO4Rqt2r4LHtUfKnQzc5IktF/TNe7FwE43Yf7Tg2A/4OcU6+2J5DyBGx4ZoLv9YG8iVhnFlmA8O3ZrTcjPk=
    Correct! There is one nominal independent variable, retirement plan. (The dependent variable, percentage contributed, is scale.)
    Actually, there is only one nominal independent variable, retirement plan. (The dependent variable, percentage contributed, is scale.)

    Example 6 of 6

    How to Improve Government Operations: Everything Up to Regression

    How many levels does the independent variable have?

    Question

    Mo2sQ1oCUhznV+GnK8Wf81khqMWDU6hRlouB3iPgqhGwNqp8hV5Xo2x5F8H4dQW44S93hes84sOVhvoga+5CnZv5lto=
    Correct! The independent variable has two levels or groups, enrolled by default and self-enrolled.
    Actually, the independent variable has two levels or groups, enrolled by default and self-enrolled.

    Example 6 of 6

    How to Improve Government Operations: Everything Up to Regression

    How many samples are there?

    Question

    F+6tP8Au4CvEs3lOf9LMVirQuTgSrCPBtsRZ6RM5Tj2W+NkAFedJqhj/DWdmlpIVzg1W27TEBgaFHxMHQBEkYpDXiHLca2YHqRv9WFfZBoNxS4IEOEpGWdg86Z5JyYAzL372HLwnwXTo4aYtWrYGZ1po2GYLoIIIrxLGY4oRDiSbWzO8
    Correct! There are two levels or groups: enrolled by default and self-enrolled. The former is represented by the sample and the latter by a population.
    Actually, there are two levels or groups: enrolled by default and self-enrolled. The former is represented by the sample and the latter by a population.

    Example 6 of 6

    How to Improve Government Operations: Everything Up to Regression

    For the level represented by a population, what parameters are known with respect to the scale dependent variable?

    Question

    f+xoaMsVRA8/kHGTamnYqLXVqtMn9oexz80p5bW94H0EpT/L4ID+m9uRFtS04DNC72DlEK5HkvdKHBoyXbtIyR46QO4wIUXsH5opPVNhFAJrPTQ4zJO3QnAsNZK2ROz/Pn6mOMUz1qhgjrGWB05VEw==
    Correct! For the scale dependent variable, percentage contributed, we know only the population mean of 7.45% – not the population standard deviation.
    Actually, for the scale dependent variable, percentage contributed, we know only the population mean of 7.45% – not the population standard deviation.

    Example 6 of 6

    How to Improve Government Operations: Everything Up to Regression

    Based on the answers to these questions, what statistical analysis could be used to determine whether the 200 employees had a significantly different percentage contribution, on average, than all employees from the previous 5 years?

    Question

    z3M9jAUHU3bYCdO82DcoGGgQ/Wm2l2MYJwz55tsh4QIuKhALDk8jNfO02eMbNcbXda3yiIorv0N1KfKJ9hB+CJ3PQyc/oM9ZnmJ0Xov4/ZoSi3RnfheGSZ8gUnNyhOCJd9/fok77YDKnuJdF1I+LI3jHo+EEp15TBUrSsoohKWwZyODxIOiz1OtHUjaLCNEa8P/QeiomlVi88Zpo48Ya5//VigUdJsUzNPdBZI1uIV4SH/1Tpnw75alnDrfYAzGuNSIMrpiFrO/SiiG+iUP/ifl5Gex1Nu8JDqpA3Z18yzHG6W6shj0LdMu5qPHxc0Q/mRCb4a8v3C5x9Hc0AxpuAZHh6CQb9Hnmp/WjbfQt45ccNJ4Hl11Aa5FCWlz3u5QyYtJ3noJQpcPaFn5p
    Correct! The researchers could have used a single-sample t test because there is one nominal independent variable, retirement plan. There are two levels or groups: enrolled by default and self-enrolled. The former is represented by a sample and the latter by a population. There is a scale dependent variable, percentage contributed, and we know the population mean, but not the population standard deviation.
    Actually, that’s not the correct statistical analysis. The researchers could have used a single-sample t test because there is one nominal independent variable, retirement plan. There are two levels or groups: enrolled by default and self-enrolled. The former is represented by a sample and the latter by a population. There is a scale dependent variable, percentage contributed, and we know the population mean, but not the population standard deviation.

    16.1 Activity Completed!

    Congratulations! You have completed the activity and gained some good experience in choosing the best hypothesis test.