Chapter 17. Getting More Responses to Emails: Everything Up to Chi-Square
Introduction
By Warren Fass, University of Pittsburgh Bradford, and Susan A. Nolan, Seton Hall University
Moore, A. (2016, February 12). 7 tips for getting more responses to your emails (with data!). Opens in new window https://blog.boomerangapp.com/2016/02/7-tips-for-getting-more-responses-to-your-emails-with--data/?utm_medium=email&utm_source=year+in+review&utm_content=CTA
Introduction

In this activity, we will consider various findings from the Boomerang article, “7 Tips for Getting More Responses to Your Emails (With Data!)” (Moore, 2016). Then you will identify statistical analyses that could be used to support the various conclusions.
Example 1 of 6

Most of us have sent an email – maybe even an important one – and never received a response. Now, maybe a technological tool can help you change that.
Boomerang is an add-on for email that helps manage the seemingly endless stream of messages most of us get. One of its services is a reminder for when a particular email doesn’t receive a response by a certain date, which gives the email sender a chance to follow up. Just tell Boomerang to turn on this service for a particular email and provide the date on which the reminder is desired.
Boomerang, the company that makes the tool of the same name, analyzed data from 40 million emails in which people used this reminder service. From this analysis, they developed six tips that lead to a higher email response rate (Moore, 2016).
Example 1 of 6
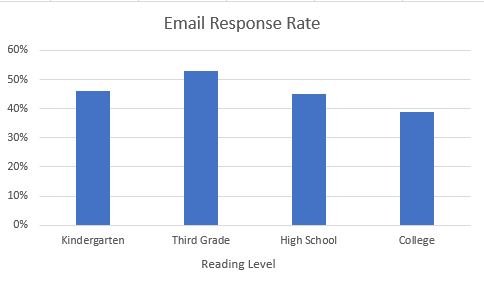
Boomerang reported that their “most surprising finding was that the reading grade level of your emails has a dramatic impact on response rates.” For example, they reported that emails were more likely to get a response when they were written at a 3rd-grade level than at a college level. The bar graph here shows the response rates for four different grade levels. Bottom line: Keep it simple.
Email Response Rate, Image Long Description
The bar graph showing the e-mail response rates for four different grade levels. In the table below, the left column is the grade level, and the right column is the rate.
| Kindergarten | 46 |
| Third Grade | 53 |
| High School | 45 |
| College | 39 |
Example 1 of 6
Which statistical test could be used to determine if there was a relation between the two variables – reading level and response category? Note that these response rates were calculated by first counting how many emails in each category received responses and how many did not receive responses. Also, remember that ordinal data can be treated as nominal when they represent categories.
Now skip ahead to the next example by clicking here. Or, for more practice walking through the flowchart questions, simply click the Next button in the bottom right corner of the screen.
Example 1 of 6
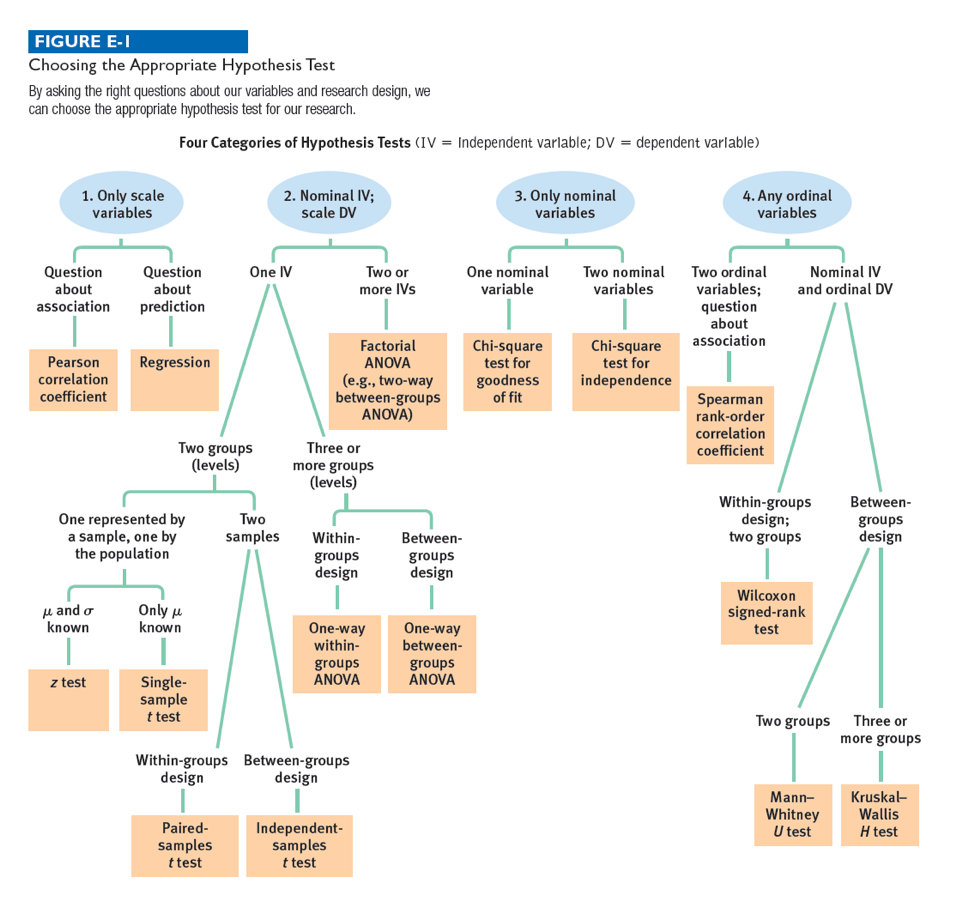
In which of the following four categories does this situation fall? Click to see the data again. And click on the flowchart button to see the overview for choosing the best test.
Example 1 of 6
How many nominal variables are there?
Example 1 of 6
Based on the answers to these questions, which statistical test сould be used to determine if there was a relationship between the two variables, reading level and response rate?
Example 2 of 6

Boomerang also reported that emails that received responses tended to be positive or negative in tone, rather than neutral in tone. All emails received a rating ranging from 0, which represented a neutral email with no emotion, to 1, which represented an emotional email that was either positive or negative in tone. Boomerang reported an example of a neutral email with a 0 emotion rating: “Hey, I was thinking about you earlier. Do you want to get pizza?” And of a positive email with a 0.55 emotion rating: “Hey, it would be really great to see you and catch up? Do you want to get pizza?” A negative email example is “I had an awful experience at your store today. The clerk was very rude.” This negative email received an emotion rating of 0.35. Emails that did not receive responses were more likely to receive neutral ratings, and emails that did receive responses were more likely to receive emotional ratings, either positive or negative.
Example 2 of 6
What statistical analysis could be used to determine whether there was a significant difference between the ratings from the two groups—emails that received responses and emails that did not receive responses?
Now skip ahead to the next example by clicking here. Or, for more practice walking through the flowchart questions, simply click the Next button in the bottom right corner of the screen.
Example 2 of 6
In which of the following four categories does this situation fall? Click to see the data again. And click on the flowchart button to see the overview for choosing the best test.
Boomerang also reported that emails that received responses tended to be positive or negative in tone, rather than neutral in tone. All emails received a rating ranging from 0, which represented a neutral email with no emotion, to 1, which represented an emotional email that was either positive or negative in tone. Boomerang reported an example of a neutral email with a 0 emotion rating: “Hey, I was thinking about you earlier. Do you want to get pizza?” And of a positive email with a 0.55 emotion rating: “Hey, it would be really great to see you and catch up? Do you want to get pizza?” A negative email example is “I had an awful experience at your store today. The clerk was very rude.” This negative email received an emotion rating of 0.35. Emails that did not receive responses were more likely to receive neutral ratings, and emails that did receive responses were more likely to receive emotional ratings, either positive or negative.
Example 2 of 6
How many nominal independent variables are there?
Example 2 of 6
How many levels does the independent variable have?
Example 2 of 6
How many samples are there?
Example 2 of 6
What type of design is this?
Example 2 of 6
Based on the answers to these questions, what statistical analysis could be used to determine whether there was a significant difference in emotional ratings between the two groups?
Example 3 of 6
Boomerang also reported that the frequency of responding to emails was related to the length of the emails. Emails containing 75-100 words were responded to more frequently than emails containing 25 or fewer words. Imagine that we recruited 20 adult participants. We ask each participant how frequently they respond, on a scale of 1-7 (1 = not very, 7 = very), to emails containing 25 or fewer words. We ask those same participants how often they respond to emails containing 75-100 words.
Which statistical test could be used to determine if there was a significant difference between the participants’ ratings of the two types of email length?
Now skip ahead to the next example by clicking here. Or, for more practice walking through the flowchart questions, simply click the Next button in the bottom right corner of the screen.
Example 3 of 6
In which of the following four categories does this situation fall? Click to see the data again. And click on the flowchart button to see the overview for choosing the best test.
Example 3 of 6
How many nominal independent variables are there?
Example 3 of 6
How many levels does the independent variable have?
Example 3 of 6
How many samples are there?
Example 3 of 6
What type of design is this?
Example 3 of 6
Based on the answers to these questions, which statistical test could be used to determine if there was a significant difference between the participants’ ratings of the two types of email length?
Example 4 of 6
Boomerang reported that the number of questions asked in an email was also related to the likelihood of responding: “We found that emails that asked 1-3 questions are 50% more likely to get a response than emails asking no questions.” However, asking too many questions also lowers the response rate: Boomerang’s results indicated that “an email with 3 questions is 20% more likely to get a response than an email with 8 or more!” Imagine that we recruited 30 undergraduates, and randomly assigned them to one of three groups: The first group would be shown an email containing 1-3 questions; the second group would be shown an email containing 4-7 questions; and the third group would be shown an email containing 8 or more questions. After viewing their respective emails, the participants would be asked to rate the likelihood, on a scale of 1-7 (1 = not very, 7 = very), that they would respond to the emails.
Which statistical test could be used to determine if there was a significant difference among the three groups’ ratings?
Now skip ahead to the next example by clicking here. Or, for more practice walking through the flowchart questions, then simply click the Next button in the bottom right corner of the screen.
Example 4 of 6
In which of the following four categories does this situation fall? Click to see the data again. And click on the flowchart button to see the overview for choosing the best test.
Example 4 of 6
How many nominal independent variables are there?
Example 4 of 6
How many levels does the independent variable have?
Example 4 of 6
What type of design is this?
Example 4 of 6
Based on the answers to these questions, which statistical test could be used to determine if there was a significant difference in likelihood of responding ratings among the three variables: 1-3 questions, 4-7 questions, 8 or more questions?
Example 5 of 6
Boomerang also presented a finding about the relation between the number of words in the subject line of an email and the likelihood of responding to that email. According to Boomerang, subject lines containing 3 or 4 words received more responses than emails with a greater number of words in the subject line. Imagine that we recruited 30 people. We present each person with an email in which the number of words in the subject line varied. We also ask each person to rate the likelihood, on a scale of 1-10 (1 = not very, 10 = very) of responding to that email.
Which statistical test could be used to determine if there was a relation between the two variables – number of words in subject line and likelihood-of-responding rating?
Now skip ahead to the next example by clicking here. Or, for more practice walking through the flowchart questions, simply click the Next button in the bottom right corner of the screen.
Example 5 of 6
In which of the following four categories does this situation fall? Click to see the data again. And click on the flowchart button to see the overview for choosing the best test.
Example 5 of 6
Is the research question about association or prediction?
Example 5 of 6
Based upon the answers to these questions, which statistical test could be used to determine if there was a relation between the two variables – number of words in subject line and number of responses?
Example 6 of 6
Let’s look at one last finding from the Boomerang article. According to Boomerang, when writing an email, people should include “more opinions and more subjectivity!” Boomerang indicated “the more opinionated the content of the email, the higher the response rate climbed.” They reported that subjective emails were more likely to receive a response than objective emails. But let’s say we didn’t have these data yet, and only knew that there was a 42% response rate for objective emails.
So, we recruit 20 people to receive subjective emails that are otherwise identical to the objective emails used to find the 42% rate. We wait 48 hours and then indicate whether there was a response or no response to that email.
What statistical analysis could be used to determine whether there was a significant difference in the response rate that we observed for subjective emails compared to the known Boomerang response rate for objective emails? Note that the response category was calculated by counting how many emails received a response and how many did not receive a response.
Now skip ahead to the end of the activity by clicking here. Or, for more practice walking through the flowchart questions, simply click the Next button in the bottom right corner of the screen.
Example 6 of 6
In which of the following four categories does this situation fall? Click to see the data again. And click on the flowchart button to see the overview for choosing the best test.
So, we recruit 20 people to receive subjective emails that are otherwise identical to the objective emails used to find the 42% rate. We wait 48 hours and then indicate whether there was a response or no response to that email.
What statistical analysis could be used to determine whether there was a significant difference in the response rate that we observed for subjective emails compared to the known Boomerang response rate for objective emails? Note that the response category was calculated by counting how many emails received a response and how many did not receive a response.
Example 6 of 6
How many nominal variables are there?
Example 6 of 6
Based on the answers to these questions, what statistical test could be used to determine whether there was a significant difference in the response rate that we observed compared to the known Boomerang response rate?
17.1 Activity Completed!

Congratulations! You have completed the activity and gained some good experience in choosing the best hypothesis test.