Chapter 18. Crisis Text Line – Crisis Trends: Everything Up to Nonparametric Tests with Ordinal Data
Introduction
By Warren Fass, University of Pittsburgh Bradford, and Susan A. Nolan, Seton Hall University
Crisis Trends (February 2, 2017). Crisis text line. Opens in new window http://crisistrends.org/.
Introduction
In this activity, we will consider various findings from the Crisis Text Line, a resource that offers crisis counseling via text messages: http://crisistrends.org/. Then you will identify statistical analyses that could be used to support the various conclusions.
Example 1 of 6

“help something happened last night.”
“i just feel awful... im in the bathroom at my school crying.”
“I feel completely invisible.”
“Why can't I be happy?!”
These are just some of the texts that kicked off conversations with volunteers trained to help people in crisis. Since 2013, Crisis Text Line has been available for people in the U.S. to seek help when faced with difficult or tragic circumstances. As of February 2017, over 30 million text messages have been exchanged, helping people cope with bullying, substance use, sexual abuse, thoughts of suicide, and many other psychological issues. Just text HELLO to 741 741 if you or a friend ever needs instant help.
Researchers can apply for access to raw data – stripped of all identifying information – from the Crisis Text Line. As their Web site tells us, “The anonymous data collected by text is teaching us when crises are most likely to happen — and helping schools and law enforcement to prepare for them.” Universities, for example, might use trends from these data to plan mental health initiatives on campus.
But anyone can go online to http://crisistrends.org/ and play with the data via a series of interactive graphs. (We’ll call this interactive Web site “Crisis Trends” for short in the scenarios below.) What can you learn be exploring the data? We’ll examine several data-driven trends. For each trend described in this activity, identify the statistical analysis that could have be used to draw a conclusion.
Example 1 of 6
Crisis Trends allows visitors to view the patterns of crisis texting across the U.S. For example, Crisis Trends provides ranks for the frequencies of texting data for each of 18 different psychological issues (e.g., bullying, friend issues, and depression) for all states. Imagine that we determined the rankings of a sample of states in terms of the frequencies of texts about bullying issues for 2016. So, the state with the most texts related to bullying would be ranked one. Imagine that we also determined the rankings of these same states for the frequencies of texts about friend issues, also for 2016. Similarly, the state with the most texts related to friend issues would be ranked one.
Which statistical test could be used to determine if the states’ ranks for bullying and friend issues were related?
Example 1 of 6
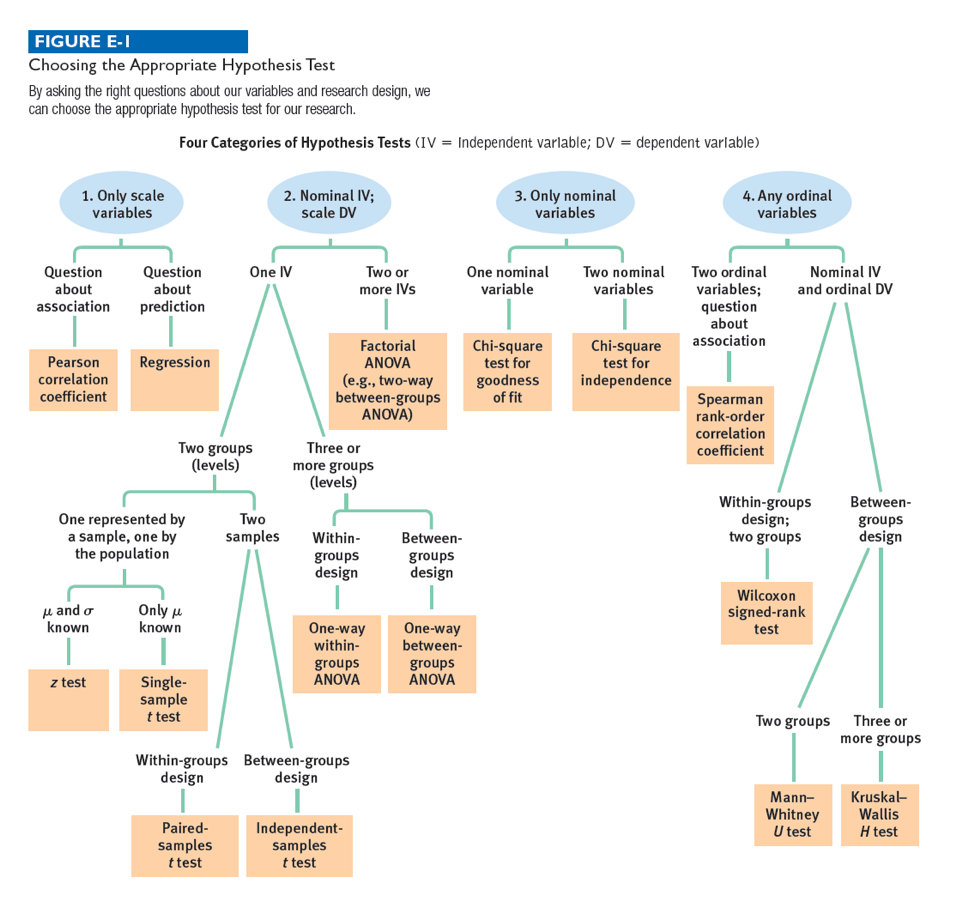
In which of the following four categories does this situation fall? Click to see the data again. And click on the flowchart button to see the overview for choosing the best test.
Example 1 of 6
We know there is at least one ordinal variable. In which of the following categories – both involving ordinal variables – does this situation fall?
Example 1 of 6
Based on the answers to these questions, which statistical test could be used to determine if there was a relationship between the two variables, bullying rank and friend issues rank?
Example 2 of 6
Crisis Trends also allows us to look at trends for frequency of texts from any month. For example, let’s say we want to know whether depression-related texts occurred more frequently in December than in January in 2016. Imagine that we take a sample of days from each month and treat each day as a participant; let’s say we look at 11 days, or participants, in January, and 10 days, or participants, in December. Each participant (day) receives a score for the number of texts related to depression occurring during that day.
The bar graph here depicts hypothetical means for samples of days from December and January. These means are based on the actual data for those months – 100 depression-related texts for January and 88 depression-related texts for December.
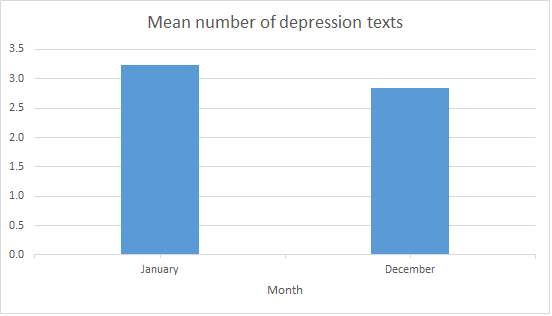
The mean numbers of depression texts in January and December, Image Long Description
The mean numbers of depression texts in January and December. The left column represents the month, and the right column contains the corresponding value.
| Month | Mean Number of Depression Texts |
|---|---|
| January | 3.23 |
| December | 2.84 |
Example 2 of 6
What statistical analysis could be used to determine whether there was a significant difference between the numbers of texts for January and December in 2016?
Example 2 of 6
In which of the following four categories does this situation fall? Click to see the data again. And click on the flowchart button to see the overview for choosing the best test.
Crisis Trends also allows us to look at trends for frequency of texts from any month. For example, let’s say we want to know whether depression-related texts occurred more frequently in December than in January in 2016. Imagine that we take a sample of days from each month and treat each day as a participant; let’s say we look at 11 days, or participants, in January, and 10 days, or participants, in December. Each participant (day) receives a score for the number of texts related to depression occurring during that day. The bar graph here depicts hypothetical means for samples of days from December and January. These means are based on the actual data for those months – 100 depression-related texts for January and 88 depression-related texts for December.
Example 2 of 6
How many nominal independent variables are there?
Example 2 of 6
How many levels does the independent variable have?
Example 2 of 6
How many samples are there?
Example 2 of 6
What type of design is this?
Example 2 of 6
Based on the answers to these questions, what statistical analysis could be used to determine whether there was a significant difference in the number of texts between the two groups?
Example 3 of 6
Crisis Trends also allows us to look at the frequency of texts about different crises, such as depression-related texts, occurring during a given month. Let’s say that we wonder whether the frequency of texts may be related to temperature. Imagine that we take a sample of days from 2015 and treat each day as a participant. Let’s say we look at 60 days, or participants, for 2015. Each participant (day) receives two scores: the number of depression-related texts received that day and the high temperature.
Which statistical test could be used to determine if there was a significant relation between the numbers of texts and temperature?
Example 3 of 6
In which of the following four categories does this situation fall? Click to see the data again. And click on the flowchart button to see the overview for choosing the best test.
Example 3 of 6
Is the research question about association or prediction?
Example 3 of 6
Based upon the answers to these questions, which statistical test could be used to determine if there was a significant relation between the number of depression-related texts and temperature?
Example 4 of 6
What is a more common problem among Crisis Trend texters – substance abuse or health issues? The graph below shows the frequency of each crisis over time. Imagine that participants in this study are a sample of months from 2015 and 2016. Each month gets two scores – the number of texts related to substance abuse issues and the number of texts related to health issues.
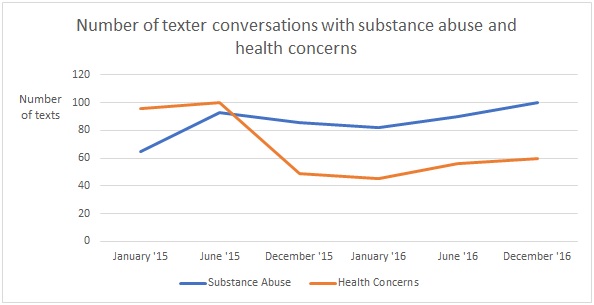
The numbers of texter conversations with substance abuse and health concerns over months from 2015 and 2016., Image Long Description
The numbers of texter conversations with substance abuse and health concerns over months from 2015 and 2016. The first column represents the month, the second column shows the corresponding number of texts related to substance abuse, and the last column contains the corresponding number of texts related to health concerns.
| Month | Substance Abuse | Health Concerns |
|---|---|---|
| January 2015 | 65 | 96 |
| June 2015 | 93 | 100 |
| December 2015 | 86 | 49 |
| January 2016 | 82 | 45 |
| June 2016 | 90 | 56 |
| December 2016 | 100 | 60 |
Example 4 of 6
Which statistical test could be used to determine if there was a significant difference between the number of texts for each month (participant)?
Example 4 of 6
In which of the following four categories does this situation fall? Click to see the data again. And click on the flowchart button to see the overview for choosing the best test.
Example 4 of 6
How many nominal independent variables are there?
Example 4 of 6
How many levels does the independent variable have?
Example 4 of 6
How many samples are there?
Example 4 of 6
What type of design is this?
Example 4 of 6
Based on the answers to these questions, which statistical test could be used to determine if there was a significant difference between the number of texts for the two groups?
Example 5 of 6
Are stress-related issues more common for people living in certain regions of the U.S.? For example, Crisis Trends provides the ranks for stress related-issues for individual states for a specific year. Imagine that we want to look at the stress related-ranks for the year 2015. We then separate the 48 contiguous states into the following groups: states that are east of the Mississippi River and states that are west of the Mississippi River. The separation would result in 26 states east of the Mississippi River and 22 states west of the Mississippi River (the states are considered the participants). We could determine the stress-related ranks of a randomly selected sample of states from each group.
Which statistical test could be used to determine if there was a significant difference between the ranks for the two groups?
Example 5 of 6
In which of the following four categories does this situation fall? Click to see the data again. And click on the flowchart button to see the overview for choosing the best test.
Example 5 of 6
We know there is at least one ordinal variable. In which of the following categories – both involving ordinal variables – does this situation fall?
Example 5 of 6
What type of design is this?
Example 5 of 6
How many groups (regions) are being studied?
Example 5 of 6
Based upon the answers to these questions, what statistical analysis could be used to determine if there was a significant difference between the ranks for the two groups?
Example 6 of 6
Let’s look at one more set of data from Crisis Trends. Are there differences in the numbers of suicidal-thought texts based on time of the year? Imagine that we take a sample of days from each month and treat each day as a participant. Let’s say we look at 20 days (or participants) in January, 20 days (or participants) in June, and 20 days (or participants) in December. Each day (participant) would receive a score for the number of texts sent that day related to suicidal-thoughts.
Which statistical test could be used to determine if there were significant differences in the number of texts sent during each of the three months?
Example 6 of 6
In which of the following four categories does this situation fall? Click to see the data again. And click on the flowchart button to see the overview for choosing the best test.
Example 6 of 6
How many nominal independent variables are there?
Example 6 of 6
How many nominal independent variables are there?
Example 6 of 6
What type of design is this?
Example 6 of 6
Based on the answers to these questions, what statistical analysis could be used to determine if there were significant differences in the number of texts sent during each of the three months?
18.1 Activity Completed!

Congratulations! You have completed the activity and gained some good experience in choosing the best hypothesis test.