Introduction
(Slide 1 of 26)

Chapter 9. The Open Syllabus Project: Everything Up to the Single-Sample t Test

Which Test Is Best?
true
true
You must complete any questions on this slide before you can move on to the next slide.

The Open Syllabus Project: Everything Up to the Single-Sample t Test

By Marsha J. McCartney, The University of Kansas, and Susan A. Nolan, Seton Hall University

Ha, Thu-Huong. (2016). These are the books students at the top US colleges are required to read. Quartz. Opens in new window https://qz.com/602956/these-are-the-books-students-at-the-top-us-colleges-are-required-to-read/

Syllabus Explorer. (n.d.). Retrieved December 28, 2016, from Opens in new window https://opensyllabusproject.org/.

The Open Syllabus Project: Everything Up to the Single-Sample t Test

A table with books on it.
Viorika Prikhodko/E+/Getty Images

In this activity, we’ll look at some data from the Open Syllabus Project, which has collected more than a million syllabi from the Web sites of universities in Australia, Canada, New Zealand, the United Kingdom, and the United States. Data from these syllabi are available through the Syllabus Explorer, creating a truly awesome dataset that we’ll explore in this activity. Check out the website at https://opensyllabusproject.org/ for more information. Have you ever thought about the hours that your instructors spend constructing just one syllabus for a single class? The syllabus is the roadmap for the course, and is perhaps the most important document for student success. As a student, you may browse through the syllabus quickly, transfer all the important dates to your planner, and file it away. This activity might make you think more attentively about the content of your syllabi. The Open Syllabus Project has a lot of data that can be analyzed based on these syllabi! Of the over 1.1 million syllabi that have been added so far, 933,635 readings have been assigned. Just in the United States, there are 100,000 readings. We can sort these readings in various ways, including by academic discipline and state.

The Open Syllabus Project: Everything Up to the Single-Sample t Test

Let’s take a closer look at the percentage of U.S. readings that relate to the discipline of psychology. Across all states, the mean percentage of readings that are psychology–related is 12.8%. We’ll consider this the population mean. Imagine that you want to know how the Midwest fares in its psychology offerings compared with the rest of the country. You decide to look at a sample of states within the Midwest (Illinois, Michigan, Missouri, South Dakota, and Wisconsin) to determine if the mean percentage for psychology readings used in that region is significantly different than in all of the United States. The percentages for the states in the sample are: Illinois (1.7%), Michigan (2.6%), Missouri (1.4%), South Dakota (1.0%), and Wisconsin (2.5%).

The average percentage for psychology readings within the Midwest.
Data from: https://opensyllabusproject.org/ (2017)

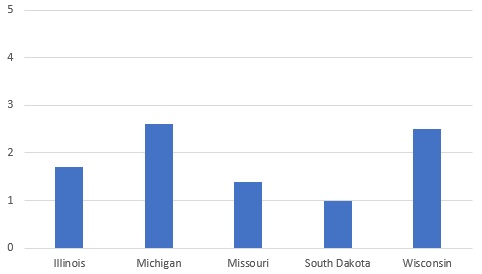
The average percentage for psychology readings within the Midwest, Image Long Description

The average percentage for psychology readings within the Midwest. The left column represents the state. The right column is the corresponding percentage.

The average percentage for psychology readings within the Midwest.
Illinois 1.7%
Michigan 2.6%
Missouri 1.4%
South Dakota 1.0%
Wisconsin 2.5%

Guidelines for choosing the appropriate hypothesis test

The Open Syllabus Project: Everything Up to the Single-Sample t Test

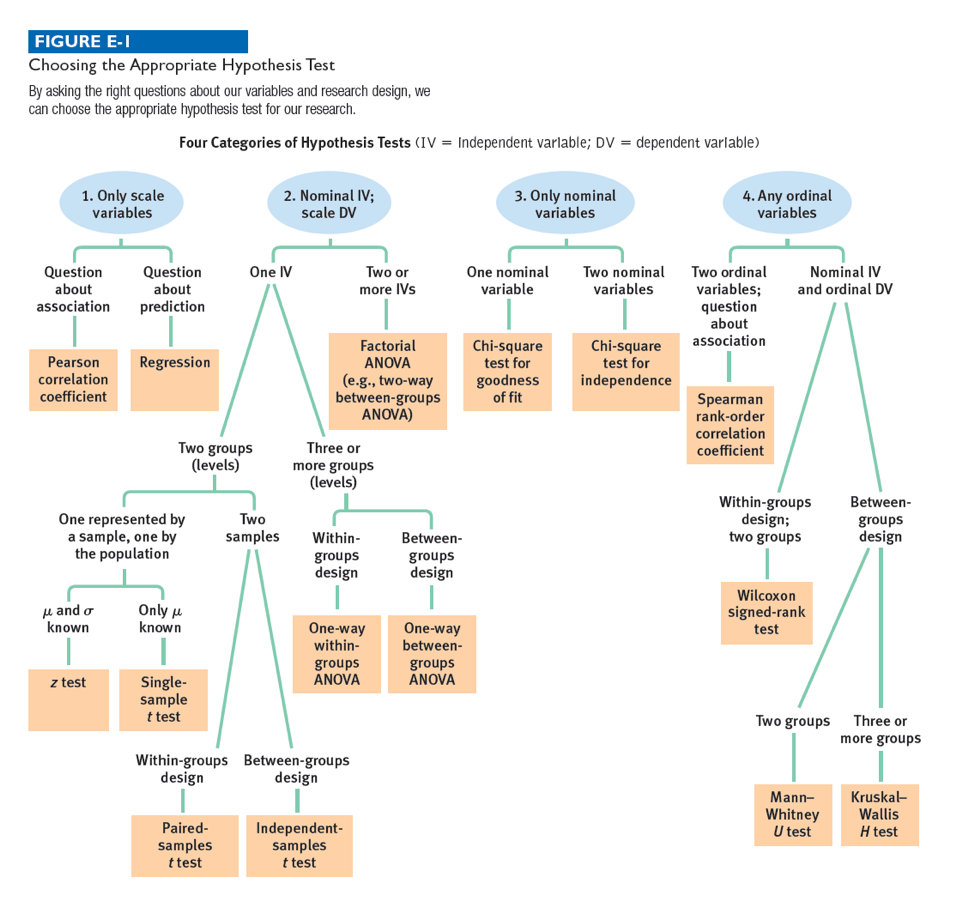
What statistical analysis could be used to determine if the mean percentage of psychology readings assigned in the Midwest was significantly different than in all of the United States?


Correct! The researchers could have used a single-sample t test. There is one nominal independent variable, region of the country. There are two levels/groups, the five states in the sample from the Midwest and the entire United States. The Midwest is represented by a randomly selected sample of states, and the population is all 50 United States. The scale dependent variable is the percentage of psychology readings used per state, and we know the population mean, but not the population standard deviation. We’ll need to estimate the standard deviation for this measure from the sample data.
 
Now skip ahead to the next example by clicking here. Or, for more practice walking through the flowchart questions, simply click the Next button in the bottom right corner of the screen.
That’s not the correct statistical analysis. Let’s walk through the questions on the flowchart in Appendix E to determine what analysis could be used in this case.

The Open Syllabus Project: Everything Up to the Single-Sample t Test

In which of the following four categories does this situation fall? Click to see the data again. And click on the flowchart button to see the overview for choosing the best test.


Correct! There is at least one nominal independent variable and a scale dependent variable.
Actually, there is at least one nominal independent variable and a scale dependent variable.

The Open Syllabus Project: Everything Up to the Single-Sample t Test

How many nominal independent variables are there?


Correct! There is one nominal independent variable, region of the country. (The dependent variable, the percentage of psychology readings used per state, is scale.)
Actually, there is one nominal independent variable, region of the country. (The dependent variable, the percentage of psychology readings used per state, is scale.)

The Open Syllabus Project: Everything Up to the Single-Sample t Test

How many levels does this independent variable have?


Correct! There are two levels/groups.
Actually, there are two levels/groups.

The Open Syllabus Project: Everything Up to the Single-Sample t Test

How many samples are there?


Correct! There are two levels/groups, the five states in the sample from the Midwest and the entire United States. The former is represented by a sample and the latter by a population.
Actually, there are two levels/groups, the five states in the sample from the Midwest and the entire United States. The former is represented by a sample and the latter by a population.

The Open Syllabus Project: Everything Up to the Single-Sample t Test

For the level represented by a population, what parameters do you know with respect to the scale dependent variable?


Correct! For the scale dependent variable, the percentage of psychology readings used per state, we know just the population mean – not the population standard deviation.
Actually, for the scale dependent variable, the percentage of psychology readings used per state, we know just the population mean – not the population standard deviation.

The Open Syllabus Project: Everything Up to the Single-Sample t Test

Based on the answers to these questions, what test would you use?


Correct! The researchers could have used a single-sample t test. There is one nominal independent variable, region of the country. There are two levels/groups, the five states in the sample from the Midwest and the entire United States. The Midwest is represented by a randomly selected sample of states, and the population is all 50 United States. The scale dependent variable is the percentage of psychology readings used per state, and we know the population mean, but not the population standard deviation. We’ll need to estimate the standard deviation for this measure from the sample data.
Actually, the researchers could have used a single-sample t test. There is one nominal independent variable, region of the country. There are two levels/groups, the five states in the sample from the Midwest and the entire United States. The Midwest is represented by a randomly selected sample of states, and the population is all 50 United States. The scale dependent variable is the percentage of psychology readings used per state, and we know the population mean, but not the population standard deviation. We’ll need to estimate the standard deviation for this measure from the sample data.

The Open Syllabus Project: Everything Up to the Single-Sample t Test

Reporter Thu-Huong Ha (2016) used the Open Syllabus database to determine which readings were most frequently assigned at a sample of ten top U.S. universities. She found that these lists were dominated by humanities readings such as Plato’s Republic and Thomas Hobbes’s Leviathan. With some extra work, Ha could compare her sample of top schools to U.S. universities of all levels. For each university, she would calculate the proportion of the most frequently assigned readings that are from humanities disciplines. She would then calculate a mean and standard deviation for all U.S. universities in the database. For the purposes of this example, we’ll treat the entire Open Syllabus database as the population.

If we wanted to compare the proportion of frequently assigned readings that are in the humanities at the sample of top universities to the proportion in the population of all universities, what analysis could we use?


Correct! The researchers could have used a z test. There is one nominal independent variable, types of universities. There are two levels/groups, the top universities versus universities of all levels. The scale dependent variable is the proportion of frequently assigned readings that are from the humanities. We know the population mean and standard deviation for this measure.
 
Now skip ahead to the next example by clicking here. Or, for more practice walking through the flowchart questions, simply click the Next button in the bottom right corner of the screen.
That’s not the correct statistical analysis. Let’s walk through the questions on the flowchart in Appendix E to determine what analysis could be used in this case.

The Open Syllabus Project: Everything Up to the Single-Sample t Test

In which of the following four categories does this situation fall? Click to see the data again. And click on the flowchart button to see the overview for choosing the best test.


Correct! There is at least one nominal independent variable and a scale dependent variable.
Actually, there is at least one nominal independent variable and a scale dependent variable.

The Open Syllabus Project: Everything Up to the Single-Sample t Test

How many nominal independent variables are there?


Correct! There is one nominal independent variable, types of universities. (The dependent variable, the proportion of frequently assigned readings that are from the humanities, is scale.)
Actually, there is one nominal independent variable, types of universities. (The dependent variable, the proportion of frequently assigned readings that are from the humanities, is scale.)

The Open Syllabus Project: Everything Up to the Single-Sample t Test

How many levels does this independent variable have?


Correct! There are two levels/groups.
Actually, there are two levels/groups.

The Open Syllabus Project: Everything Up to the Single-Sample t Test

How many samples are there?


Correct! There are two levels/groups, the top universities versus the universities of all levels. The former is represented by a sample and the latter by a population.
There are two levels/groups, the top universities versus the universities of all levels. The former is represented by a sample and the latter by a population.

The Open Syllabus Project: Everything Up to the Single-Sample t Test

For the level represented by a population, what parameters do you know with respect to the scale dependent variable?


Correct! For the scale dependent variable, the proportion of frequently assigned readings that are from the humanities, we know the population mean and standard deviation.
Actually, for the scale dependent variable, the proportion of frequently assigned readings that are from the humanities, we know the population mean and standard deviation.

The Open Syllabus Project: Everything Up to the Single-Sample t Test

Based on the answers to these questions, what test would you use?


Correct! The researchers could have used a z test. There is one nominal independent variable, types of universities. There are two levels/groups, the top universities versus universities of all levels. The scale dependent variable is the proportion of frequently assigned readings that are from the humanities, and we know the population mean and standard deviation for this measure.
Actually, the researchers could have used a z test. There is one nominal independent variable, types of universities. There are two levels/groups, the top universities versus universities of all levels. The scale dependent variable is the proportion of frequently assigned readings that are from the humanities, and we know the population mean and standard deviation for this measure.

The Open Syllabus Project: Everything Up to the Single-Sample t Test

For the next example, let’s say you are an English instructor at a college in Texas. You are interested in finding out how the use of William Strunk’s The Elements of Style at universities in Texas compares to the use of this text at universities across the entire United States. This book is the most used textbook in the database. It is listed on 3,934 syllabi. The mean number of times that this book is listed on syllabi across all 210 universities in the population is 18.73. We can calculate the mean and standard deviation for the number of syllabi that list this book at a randomly selected sample of five Texas universities: the University of Texas at Dallas, University of Texas at Austin, University of North Texas, Texas State University, and Texas A&M University. The mean for this sample of Texas universities is 82.8, with a standard deviation of 74.45.

William Strunk’s The Elements of Style in Universities of Texas
Data from: https://opensyllabusproject.org/ (2016)

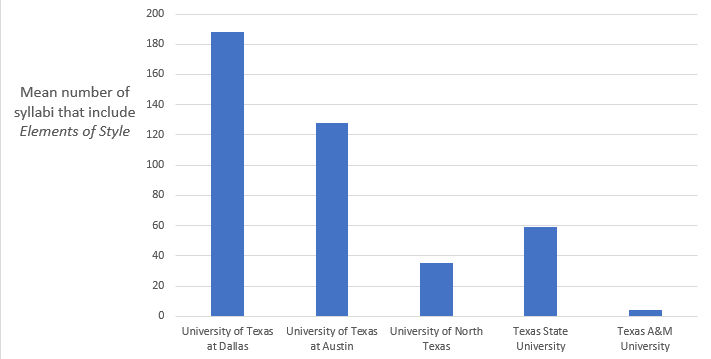
William Strunk’s The Elements of Style in Universities of Texas, Image Long Description

The mean and standard deviation for the number of syllabi that list this book at a randomly selected sample of five Texas universities. The left column is the university, and the right column is the corresponding value.

William Strunk’s The Elements of Style in Universities of Texas
University of Texas at Dallas 188
University of Texas at Austin 128
University of North Texas 35
Texas State University 59
Texas A&M University 4

The Open Syllabus Project: Everything Up to the Single-Sample t Test

What analysis could be used to find out if universities in Texas use Elements of Style a significantly different number of times than do all universities in the United States?


Correct! The researchers could have used a single-sample t test. There is one nominal independent variable, state. There are two levels/groups, universities in Texas and all states in the United States. Texas is represented by a sample of universities, and all universities in the United States are the population. The scale dependent variable is the number of times the book is used at each school. We know the population mean, but we’ll need to estimate the population standard deviation for this measure.
 
Now skip ahead to the end of the activity by clicking here. Or, for more practice walking through the flowchart questions, simply click the Next button in the bottom right corner of the screen.
That’s not the correct statistical analysis. Let’s walk through the questions on the flowchart in Appendix E to help you determine what analysis could be used in this case.

The Open Syllabus Project: Everything Up to the Single-Sample t Test

In which of the following four categories does this situation fall? Click to see the data again. And click on the flowchart button to see the overview for choosing the best test.


Correct! There is at least one nominal independent variable and a scale dependent variable.
Actually, there is at least one nominal independent variable and a scale dependent variable.

The Open Syllabus Project: Everything Up to the Single-Sample t Test

How many nominal independent variables are there?


Correct! There is one nominal independent variable, state. (The dependent variable, the number of times the book is used at each school, is scale.)
Actually, there is one nominal independent variable, state. (The dependent variable, the number of times the book is used at each school, is scale.)

The Open Syllabus Project: Everything Up to the Single-Sample t Test

How many levels does this independent variable have?


Correct! There are two levels/groups.
Actually, there are two levels/groups.

The Open Syllabus Project: Everything Up to the Single-Sample t Test

How many samples are there?


Correct! There are two levels/groups, Texas and all states in the United States. The former is represented by a sample, and the latter by a population.
Actually, there are two levels/groups, Texas and all states in the United States. The former is represented by a sample, and the latter by a population.

The Open Syllabus Project: Everything Up to the Single-Sample t Test

For the level represented by a population, what parameters are known with respect to the scale dependent variable?


Correct! For the scale dependent variable, the number of times the book is used at each school, we know the population mean but will need to estimate the population standard deviation.
Actually, for the scale dependent variable, the number of times the book is used at each school, we know the population mean but will need to estimate the population standard deviation.

The Open Syllabus Project: Everything Up to the Single-Sample t Test

Based on the answers to these questions, what test could be used?


Correct! The researchers could have used a single-sample t test. There is one nominal independent variable, state. There are two levels/groups, Texas and all states in the United States. Texas is represented by a sample of universities, and all universities in the United States are the population. The scale dependent variable is the number of times the book is used at each school. We know the population mean, but we’ll need to estimate the population standard deviation for this measure.
Actually, the researchers could have used a single-sample t test. There is one nominal independent variable, state. There are two levels/groups, Texas and all states in the United States. Texas is represented by a sample of universities, and all universities in the United States are the population. The scale dependent variable is the number of times the book is used at each school. We know the population mean, but we’ll need to estimate the population standard deviation for this measure.

Congratulations! You have completed the activity and gained some good experience in choosing the best hypothesis test.