Screen 1 of 4

Chapter 4

Question 16
true
true
You must read each slide, and complete any questions on the slide, in sequence.

Suppose the U.S. government places a price ceiling on the sale of gasoline at $2 per gallon in the accompanying figure.

A. How much of a shortage or surplus of gasoline would result? There is a of million gallons.

Correct! When the price is below the equilibrium price, a shortage will result. The quantity demanded is 30 million gallons, while the quantity supplied is 10 million gallons. The difference between the quantity demanded and quantity supplied is the amount of the shortage.
Incorrect. When the price is below the equilibrium price, a shortage will result. The quantity demanded is 30 million gallons, while the quantity supplied is 10 million gallons. The difference between the quantity demanded and quantity supplied is the amount of the shortage.
chiang4e_wio_ch04a
Video Player is loading.
Current Time 0:00
Duration 0:00
Loaded: 0%
Stream Type LIVE
Remaining Time 0:00
 
1x
    • Chapters
    • descriptions off, selected

      B. Calculate the effects of this policy in terms of the changes in consumer surplus and producer surplus. Consumer surplus by $ million, while producer surplus by $ million.

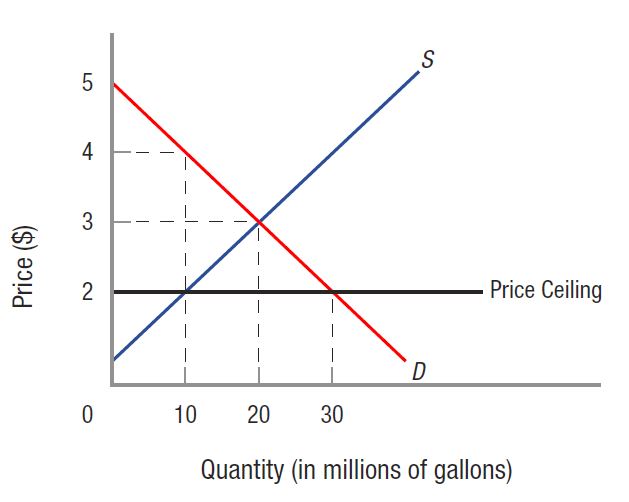
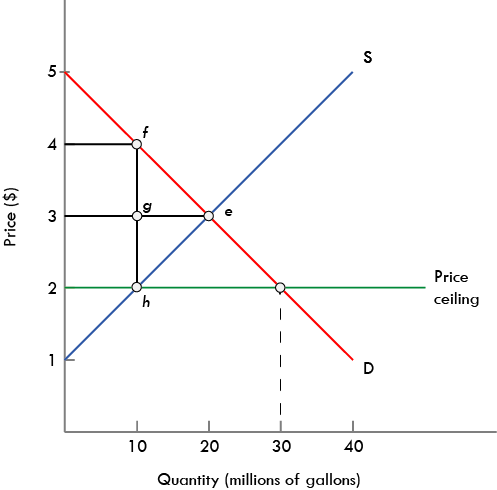
      Correct! First, consider the change in consumer surplus. The original consumer surplus is the area of the triangle bounded by the equilibrium price of $3, the vertical price axis, and the demand curve. This area is (1/2) × (20 million gallons) × ($2) = $20 million. When the price decreases, the quantity supplied decreases. The new consumer surplus is the area bounded by the new price of $2, the vertical price axis, the demand curve, and the new quantity of 10 million. In the figure below, look at the region bounded by $2, $5, f and h. To calculate the area, first look at the rectangle bounded by $2, $4, f and h. This area is $2 times 10 million, or $20 million. The area of the triangle at top is the area bounded by $4, $5 and f. This is (1/2) × (10 million) × $1, or $5 million. Thus, the new consumer surplus is $25 million. We conclude that consumer surplus increased by $5 million.Next, consider the change in producer surplus. The original producer surplus is the area of the triangle bounded by the equilibrium price of $3, the vertical price axis, and the supply curve. This area is (1/2) × (20 million gallons) × ($2) = $20 million. When the price decreases, the quantity supplied decreases. The new producer surplus is the area bounded by the new price of $2, the vertical price axis, the supply curve. In the figure below, look at the region bounded by $1, $2 and h. The area of this triangle is (1/2) × (10 million) × $1, or $5 million. Thus, the new producer surplus is $5 million. We conclude that producer surplus decreased by $15 million.
      Incorrect. First, consider the change in consumer surplus. The original consumer surplus is the area of the triangle bounded by the equilibrium price of $3, the vertical price axis, and the demand curve. This area is (1/2) × (20 million gallons) × ($2) = $20 million. When the price decreases, the quantity supplied decreases. The new consumer surplus is the area bounded by the new price of $2, the vertical price axis, the demand curve, and the new quantity of 10 million. In the figure below, look at the region bounded by $2, $5, f and h. To calculate the area, first look at the rectangle bounded by $2, $4, f and h. This area is $2 times 10 million, or $20 million. The area of the triangle at top is the area bounded by $4, $5 and f. This is (1/2) × (10 million) × $1, or $5 million. Thus, the new consumer surplus is $25 million. We conclude that consumer surplus increased by $5 million. Next, consider the change in producer surplus. The original producer surplus is the area of the triangle bounded by the equilibrium price of $3, the vertical price axis, and the supply curve. This area is (1/2) × (20 million gallons) × ($2) = $20 million. When the price decreases, the quantity supplied decreases. The new producer surplus is the area bounded by the new price of $2, the vertical price axis, the supply curve. In the figure below, look at the region bounded by $1, $2 and h. The area of this triangle is (1/2) × (10 million) × $1, or $5 million. Thus, the new producer surplus is $5 million. We conclude that producer surplus decreased by $15 million.
      Video Player is loading.
      Current Time 0:00
      Duration 0:00
      Loaded: 0%
      Stream Type LIVE
      Remaining Time 0:00
       
      1x
        • Chapters
        • descriptions off, selected

          Suppose the U.S. government places a price ceiling on the sale of gasoline at $2 per gallon in the accompanying figure.

          C. How much deadweight loss is created? Deadweight loss is $ million.

          Correct! For further review, see section “Consequences of Deviating from Market Equilibrium."
          Sorry, but this answer is incorrect. Deadweight loss is represented by the triangle between quantities 10 million and 20 million and the demand and supply curves. This value is ½ × (20 million − 10 million) × ($4 − $2) = $10 million. For further review, see section “Price Ceilings."
          Video Player is loading.
          Current Time 0:00
          Duration 0:00
          Loaded: 0%
          Stream Type LIVE
          Remaining Time 0:00
           
          1x
            • Chapters
            • descriptions off, selected

              Suppose the U.S. government places a price ceiling on the sale of gasoline at $2 per gallon in the accompanying figure.

              D. What would happen if the price ceiling is raised to $5 per gallon?

              A.
              B.
              C.
              D.

              Correct! For further review, see section “Price Ceilings."
              Sorry, but this answer is incorrect. If the price ceiling is raised to $5 per gallon, the price ceiling would no longer be binding because it is above the equilibrium price of $3. The market equilibrium would prevail, and no deadweight loss would be created. For further review, see section “Price Ceilings."
              Video Player is loading.
              Current Time 0:00
              Duration 0:00
              Loaded: 0%
              Stream Type LIVE
              Remaining Time 0:00
               
              1x
                • Chapters
                • descriptions off, selected