Chapter 13
13.1 Screen 1 of 1
Question 15
true
true
You must read each slide, and complete any questions on the slide, in sequence.
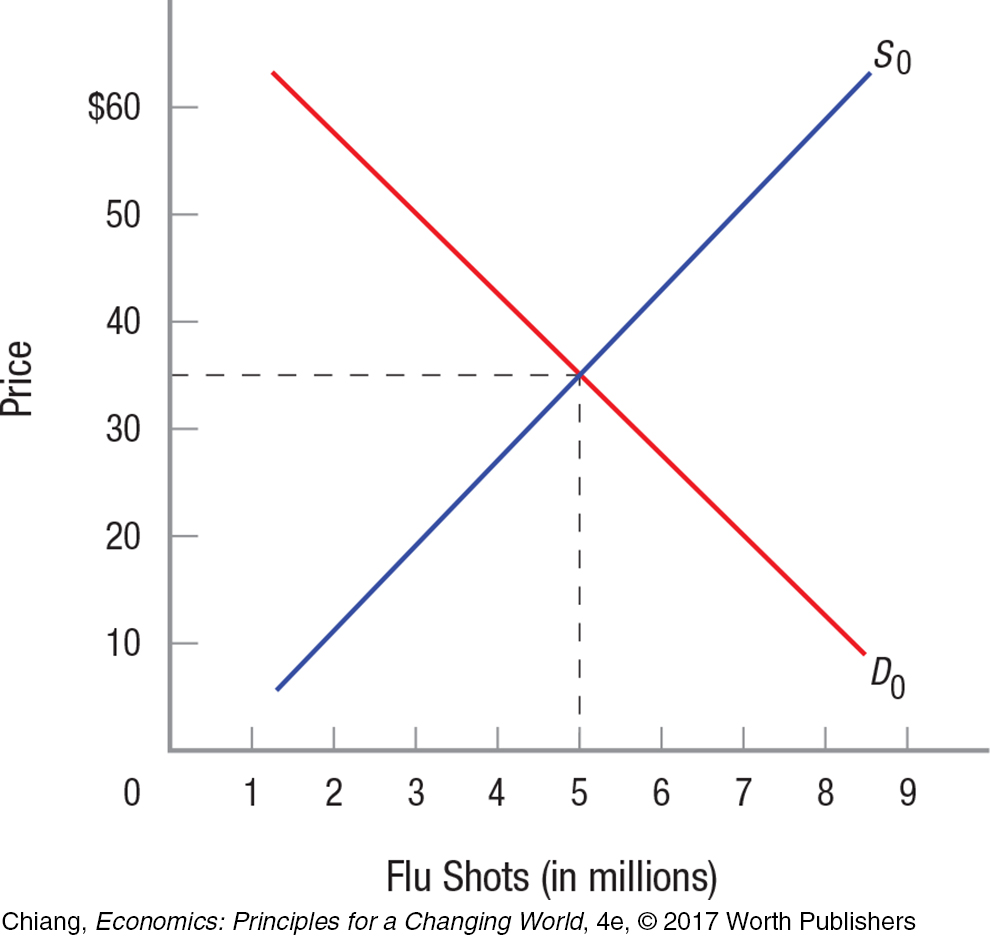
А. Suppose the market supply and demand for flu shots are shown in the graph. Not taking into account the external benefits from flu shots, the equilibrium price of flu shots is $ and the equilibrium quantity of flu shots is million.
Without considering external benefits, this market behaves in the traditional manner. Based on the intersection of the market supply and demand curves, the equilibrium price is $35 and the equilibrium quantity is 5 million flu shots.
B. Now suppose that every flu shot generates $10 in external benefits (from others being less likely to get sick). Which graph represents the effects of this positive externality?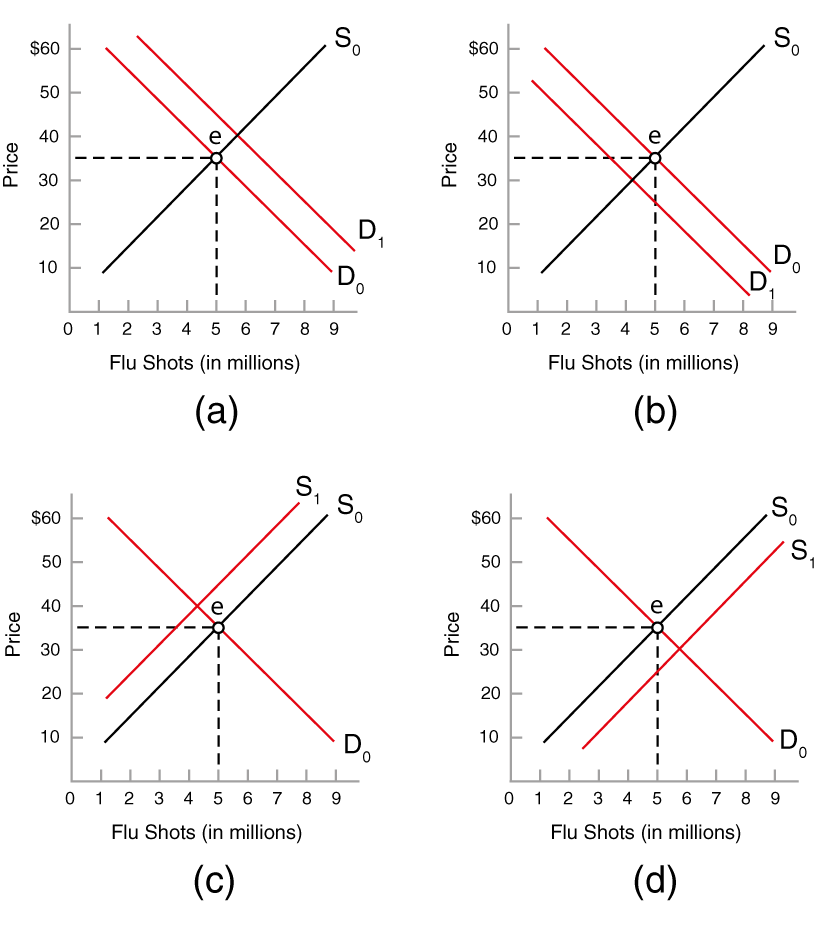
| A. |
| B. |
| C. |
| D. |
Positive externalities provide benefits to consumers, and the demand curve moves up. Since the extra value is $10 per flu shot, the demand curve shifts upward by $10, the amount of the external benefit of every flu shot.
C. Taking into account external benefits, the new equilibrium price of flu shots would be $ and the new equilibrium quantity of flu shots would be million.
The intersection of the supply curve and the new demand curve determines the new equilibrium. The equilibrium price and quantity both increase. While the vertical shift of the demand curve is $10, the price only increases by $5. Consumers do not bear the full burden or receive the full benefit of purchasing a product that provides external benefits. The value of the external benefit is partially offset by an increase in quantity supplied as firms respond to the higher price, and therefore produce more.