Chapter 35. Chapter 35 (Chapter 16 Macro)

Step 1

Work It Out
Chapter 35 (Chapter 16 Macro)
true
true
You must read each slide, and complete any questions on the slide, in sequence.

Question

In the United States, the government’s data on real growth improves over time. For instance, we now know that in the early 1970s, the economy was actually growing 4% faster than people believed. At the time, the Fed thought the economy was in a deep recession, so it mistakenly boosted money growth. The Fed’s overreaction caused inflation. Real-time surveys in the early 1970s depicted an awful economy, but as economic historians have gone back to the data, they have discovered that the economy wasn’t as awful as they thought: Someone just put the thermometer in the fridge.
Economists at the Philadelphia Federal Reserve have collected data on how our view of the economy has changed over time. These “real-time data” are summarized by Croushore and Stark in a review article entitled “A Funny Thing Happened on the Way to the Data Bank: A Real-Time Data Set for Macroeconomists” (Federal Reserve Bank of Philadelphia, Business Review, September/October 2000, 15–27). Let’s use their summary of the data and a six-sided die to see just how inaccurate our real-time views of the economy actually

We’re going to reenact the 1970s, and we’ll start figuring out how error-filled the government’s growth estimates will be. Croushore and Stark report that, on average:
i. One-sixth of the time, measured growth is 2% better than actual growth.
ii. One-third of the time, measured growth is 1% better than actual growth.
iii. One-third of the time, measured growth is 1.5% worse than actual growth.
iv. One-sixth of the time, measured growth is 3% worse than actual growth.

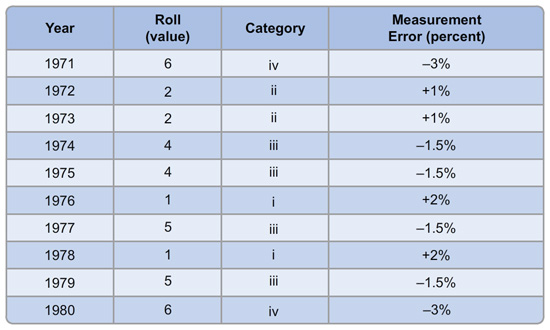
Find a six-sided die (or use Excel to simulate rolling the die) and record your rolls in the following table. If you’ve rolled a 1, count that in category I; if you roll a 2 or 3, place that in category ii; a 4 or 5 goes in category iii; and if you roll a 6, place that in category iv. Then write down how much measurement error you’ll have for that year. Example: If your first roll was a 4, that places you in category iii, so write down “–1.5%” as the amount of measurement error for 1971.

(Note: Psychologists and behavioral economists have found that people are fairly bad at generating truly random numbers on their own, so it’s best just to roll the die.)

Year Roll (value) Category Measurement Error (percent)
1971 cAimXPnyMGJgGxM6MDmaAl5PkyWvNUdilFa/aCp/e0wt/ne1+KIUgcqsPgZOmZoj wD/Pg67ZxlTUggHaWEIQssBmJv4zgs+JoP09sUX/CpNYR+vnAk1Er5qX+EUf0gre +DFhod76icGfnMwQIzMdMjIxV7KDkZ+AKXN6JV9g8rOxwrpBYBMcVnObtsKcegSe%
1972 BteSoaUd8UH5SXgVOIGFFRjmGphXHZ/KQyg0ngwTRpfY0H6Me9dfkwsteUrB+A7R H9MqfNJ6se7tNoiaqwMBvyNxFUBTu5bhZz2xIxMqK/qxg8ZNug3oq833nggFjkir CBLccGyC0fgCLPxmufXIf5ggiMMby1azMer0BOk5fTrfpnXBmtVjvL9vJfKurdmm%
1973 BteSoaUd8UH5SXgVOIGFFRjmGphXHZ/KQyg0ngwTRpfY0H6Me9dfkwsteUrB+A7R H9MqfNJ6se7tNoiaqwMBvyNxFUBTu5bhZz2xIxMqK/qxg8ZNug3oq833nggFjkir CBLccGyC0fgCLPxmufXIf5ggiMMby1azMer0BOk5fTrfpnXBmtVjvL9vJfKurdmm%
1974 MjLhH3Al41h6f3bMKVsFqn6EJBjyv79OC5TZWziHjECfsn5NO/65TS01HDZXhs8w e9P+DPQeK+qOv5lF7ZeZldAsBAmddLGdbjKySosNdDTh/kabKNkbeQThQAJ3oy6KwRFpyw== g3iSuZ52v45FlOpof8lxDr/tLgqic2wlher1WHfBX4nEExwTbg5PigpZQYBKp6dhR7XIfQ==%
1975 MjLhH3Al41h6f3bMKVsFqn6EJBjyv79OC5TZWziHjECfsn5NO/65TS01HDZXhs8w e9P+DPQeK+qOv5lF7ZeZldAsBAmddLGdbjKySosNdDTh/kabKNkbeQThQAJ3oy6KwRFpyw== g3iSuZ52v45FlOpof8lxDr/tLgqic2wlher1WHfBX4nEExwTbg5PigpZQYBKp6dhR7XIfQ==%
1976 wDm1gosQYCXRHs007qHges5GP9KuEW2uyY22tkv4auhmqTViANVn2uzf4balhjRW fWP5w3HSDpYkJlAVy0oLj4ctRLgJZVEm1VDiTiS4rOVKGLp2gdKyA7dAj6/WKMBv YOBN5NdQ7cbGwaTAwgZvQJk1txHZfWDjdzIzrm529wZt1QozfaX1eY+zHBFkGRe6%
1977 VOGkOWXnC6NpWjikT964XD7FpAAvNgrnjgI23xazGE53EiWk4LM5EfLYY2w5yhSP e9P+DPQeK+qOv5lF7ZeZldAsBAmddLGdbjKySosNdDTh/kabKNkbeQThQAJ3oy6KwRFpyw== g3iSuZ52v45FlOpof8lxDr/tLgqic2wlher1WHfBX4nEExwTbg5PigpZQYBKp6dhR7XIfQ==%
1978 wDm1gosQYCXRHs007qHges5GP9KuEW2uyY22tkv4auhmqTViANVn2uzf4balhjRW fWP5w3HSDpYkJlAVy0oLj4ctRLgJZVEm1VDiTiS4rOVKGLp2gdKyA7dAj6/WKMBv YOBN5NdQ7cbGwaTAwgZvQJk1txHZfWDjdzIzrm529wZt1QozfaX1eY+zHBFkGRe6%
1979 VOGkOWXnC6NpWjikT964XD7FpAAvNgrnjgI23xazGE53EiWk4LM5EfLYY2w5yhSP e9P+DPQeK+qOv5lF7ZeZldAsBAmddLGdbjKySosNdDTh/kabKNkbeQThQAJ3oy6KwRFpyw== g3iSuZ52v45FlOpof8lxDr/tLgqic2wlher1WHfBX4nEExwTbg5PigpZQYBKp6dhR7XIfQ==%
1980 cAimXPnyMGJgGxM6MDmaAl5PkyWvNUdilFa/aCp/e0wt/ne1+KIUgcqsPgZOmZoj wD/Pg67ZxlTUggHaWEIQssBmJv4zgs+JoP09sUX/CpNYR+vnAk1Er5qX+EUf0gre +DFhod76icGfnMwQIzMdMjIxV7KDkZ+AKXN6JV9g8rOxwrpBYBMcVnObtsKcegSe%
Answers will vary based on how the die rolls! Below you will find one example of what could have happened:

A table with eleven rows and four columns. The column headers are Year, Roll (value), category, and measurement error in percent. The second row is for 1971 with the values of 6 in the second column, 4 in the third column and minus 3 percent in the fourth column. The third row is for 1972 with the values of 2 in the second column, 2 in the third column and plus 1 percent in the fourth column. The fourth row is for 1973 with the values of 2 in the second column, 2 in the third column and plus 1 percent in the fourth column. The fifth row is for 1974 with the values of 4 in the second column, 3 in the third column and minus 1.5 percent in the fourth column. The sixth row is for 1975 with the values of 4 in the second column, 3 in the third column and minus 1.5 percent in the fourth column. The seventh row is for 1976 with the values of 1 in the second column, 1 in the third column and plus 2 percent in the fourth column. The eighth row is for 1977 with the values of 5 in the second column, 3 in the third column and minus 1.5 percent in the fourth column. The ninth row is for 1978 with the values of 1 in the second column, 1 in the third column and plus 2 percent in the fourth column. The tenth row is for 1979 with the values of 5 in the second column, 3 in the third column and minus 1.5 percent in the fourth column. The eleventh row is for 1980 with the values of 6 in the second column, 4 in the third column and minus 3 percent in the fourth column.

Question

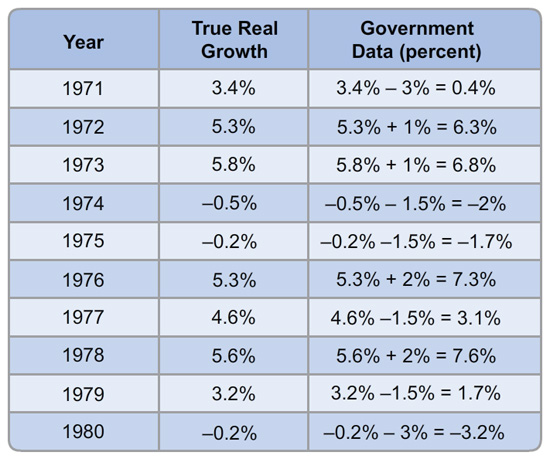
Let’s see what values we get when we add together the true real growth rate (which economists will only know years later) with the measurement error in the previous table. For “true real growth,” we use the most recent data in the following table—but of course even these estimates could change in the future. The sum of this “true real growth” and the measurement error from our previous table is the actual government data that will wind up in the Federal Reserve chair’s hands. Example: If your first roll was a 4, that placed you in category iii, so subtract 1.5% from the true 1971 growth rate to yield a real-time government report of 1.9% annual growth.

Year True Real Growth Government Data (percent)
1971 3.4% rHTRSAtDl3zwe1j4lsos3TquCuZ0oA0qK+B50mHkB6Zt7FK4xZIS2qKggMHbQ6mLRxINzEjWdtz5Q2L8iCJrcA==%
1972 5.3% 9Fmy9n8yF4WKM+1cy61aAIFpxKZtqyXcrZySjuNh3nugpks3lz7benyo6zzfcPTVbQImfzcYcqh03c1LithyaQ==%
1973 5.8% wQFuza1L2WPMMLotpMAcJBX0Ar07sJa2I2D00g8nBjkR7GBpKWfPXD8eWa+OL7gntNgPbc75ZKzEuHI6G6MBpw==%
1974 -0.5% yPdP8xCHx7oJ6HG7arI6pu719Vbdw7CCKSdH0XrtkxM5MzawFvmZZQ9+Fbr2CEvVTNC4vNg3hrt8WF4Z/c5LSg==%
1975 -0.2% bnN2jWIEIBxdhBQImm4kHs6qJUCmPQGOTcepF0k0kdUc5w7KOy9PzFzGJZaBDGpaPo2kKBPR+kJfu/ZF4m6yu7KDz7A=%
1976 5.3% PqKPMlA0Pf5kS734JZEXaSOCCXve+gP4S1YeXKXjQBm6CeRQ6NXO4+13h68LahD46tVf6osUjKd04lESf9bNMw==%
1977 4.6% P99bbjj7kv7VnhLGEXD5Uukqa+FVA0qhAAVCZjzcq8w1PRnKR2X6ELF8h1VrLSsW6bvAY0+fKzh4AQXiJ9iUEw==%
1978 5.6% JEiI701W+B5NUH9Dzk76ny6nzTKFYE4X8Lz8FF5Bxv5Ek5UlRouEpzPmgasiIqwc072uVWjPrHQ6pzSwuO7dSQ==%
1979 3.2% xe9tVGgY+rEG/Ti/cFVpvNkVhpFR4VNE1DtGXWkeFQlKinEsmKjWKwtmNA7Nu1IIS5OnfIRhlWOap4H3XKjAhw==%
1980 -0.2% k1ut1o4RnbYr2P3+Ik05dtNFMXKYYIpI3yvH8XAirtFF3fnAksQZKDm7IpIwFX50J+xEq+IlCSR1KjOETEooKQ==%
Answers will depend on your result from Question 1. Based on the result from Question 1:

A table with eleven rows and four columns. The column headers are Year, true real growth, and government data in percent. The second row is for 1971 and has the value of 3.4 percent in the second column and the difference between 3.4 percent and 3 percent equal to 0.4 percent in the third column. The third row is for 1972 and has the values of 5.3 percent in the second column and sum of 5.3 percent and 1 percent equal to 6.3 percent in the third column. The fourth row is for 1973 and has the value of 5.8 percent in the second column and the sum of 5.8 percent and 1 percent equal to 6.8 percent in the third column. The fifth row is for 1974 and has the value of minus 0.5 percent in the second column and the difference between minus 0.5 percent and 1.5 percent equal to minus 2 percent in the third column. The sixth row is for 1975 and has the value of minus 0.2 percent in the second column and the difference between minus 0.2 percent and 1.5 percent equal to minus 1.7 percent in the third column. The seventh row is for 1976 and has the value of 5.3 percent in the second column and the sum of 5.3 percent and 2 percent equal to 7.3 percent in the third column. The eighth row is for 1977 and has the value of 4.6 percent in the second column and the difference between 4.6 percent and 1.5 percent equal to 3.1 percent in the third column. The ninth row is for 1978 and has the value of 5.6 percent in the second column and the sum of 5.6 percent and 2 percent equal to 7.6 percent in the third column. The tenth row is for 1979 and has the value of 3.2 percent in the second column and the difference between 3.2 percent and 1.5 percent equal to 1.7 percent in the third column. The eleventh row is for 1980 and has the value of minus 0.2 percent in the second column and the difference between minus 0.2 percent and 3 percent equal to minus 3.2 percent in the third column.

Question

In your simulation, how many times was the government data off by 2% or more (that is, how many times is the measurement error +/- 2% or more)?
sUn25mJobCl9SWZHuCDNiRaSO1vUuwoFQmOS9pfsS0qAAYUTGNVkwQgspAH+eNXm

Answers will depend on your result from Question 1. Based on the result from Question 1 the government data was off by 2% or more by four times, in 1971, 1976, 1978 and 1980.

Question

If the potential growth rate in the 1970s was actually 3.6% (the average growth rate in the 1970s), then in how many years did your government data give values below 3.6% when true real growth was above 3.6%?
sUn25mJobCl9SWZHuCDNiRaSO1vUuwoFQmOS9pfsS0qAAYUTGNVkwQgspAH+eNXm

How often did the reverse occur, with your government data above the potential rate while true real growth was below?
sUn25mJobCl9SWZHuCDNiRaSO1vUuwoFQmOS9pfsS0qAAYUTGNVkwQgspAH+eNXm

Answers will depend on your result from Question 1. Based on the result from part (a) this occurred once in 1977 when the true real growth was 4.6% and the government’s data was 3.1%.

Question

Add together your answers to the two questions from Question 4. sUn25mJobCl9SWZHuCDNiRaSO1vUuwoFQmOS9pfsS0qAAYUTGNVkwQgspAH+eNXm This is the number of times that even very good central banker would have wanted to push AD in the wrong direction (it’s the number of times this weather vane was pointing in entirely the wrong direction).

Answers will depend on your result from Question 1. Based on our results from Question 1, this would have occurred only in 1977 when the true growth rate was 4.6% while our measured growth rate was 3.1%. Since our measured growth rate was below the average, the Central Banker would want to aggregate demand in what turns out to be the wrong direction. If you had cases where the government’s data was above 3.6% while the true growth was above 3.6% then these would be cases where the Central Banker would want restrict aggregate demand when they should have been pushing AD up.
4:44