Chapter 1. Chapter 8(23)
Step 1
Question
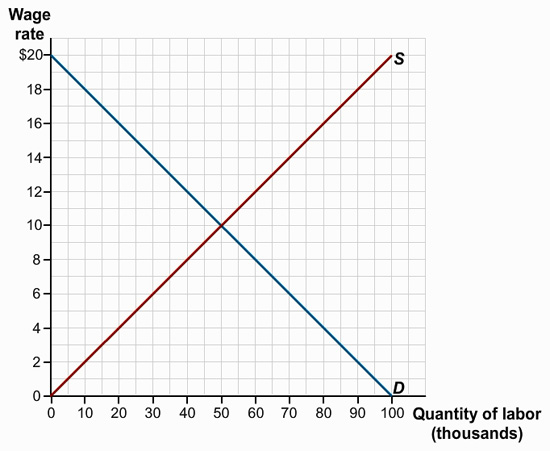
There is only one labor market in Profunctia. All workers have the same skills, and all firms hire workers with these skills. Use the accompanying diagram, which shows the supply of and demand for labor, to answer the following questions.

The graph shows the supply and demand curves labeled S and D respectively. The horizontal axis is labeled ‘Quantity of labor’ in units of thousands. The values range from 0 to 100 in increments of ten. The vertical axis is labeled ‘Wage rate’ in dollars. The values range from 0 to 20 in increments of two. The supply curve S is an upward sloping curve originating at point 0 of the horizontal and vertical axes. The demand curve D is a downward sloping curve originating at point 0 on the horizontal axis and 20 on the vertical axis. The line ends at point 100 on the horizontal axis and 0 on the vertical axis.
What is the equilibrium wage rate in Profunctia? At this wage rate, what are the level of employment, the size of the labor force, and the unemployment rate?
Equilibrium wage: $ a4pYMm1cGhfmVIcv40vuJw==
Question
Level of employment: 8o7nxaA23zDZj8oYN+RB2g==
Question
Labor force: 8o7nxaA23zDZj8oYN+RB2g==
Question
Unemployment rate: 78YzBHhvBzA50GXZ percent
Step 2
Question
If the government of Profunctia sets a minimum wage equal to $12, what will be the level of employment, the size of the labor force, and the unemployment rate?

The graph shows the supply and demand curves labeled S and D respectively. The horizontal axis is labeled ‘Quantity of labor’ in units of thousands. The values range from 0 to 100 in increments of ten. The vertical axis is labeled ‘Wage rate’ in dollars. The values range from 0 to 20 in increments of two. The supply curve S is an upward sloping curve originating at point 0 of the horizontal and vertical axes. The demand curve D is a downward sloping curve originating at point 0 on the horizontal axis and 20 on the vertical axis. The line ends at point 100 on the horizontal axis and 0 on the vertical axis.
Level of employment: oOWeJMckLq0qBmOfVf/uJg==
Question
Labor force: 3N1zdPKp0pHkYn9M6ec4vQ==
Question
Unemployment rate: /rGox/IeBhAB82Tc percent
Step 3
Question
If unions bargain with the firms in Profunctia and set a wage rate equal to $14, what will be the level of employment, the size of the labor force, and the unemployment rate?

The graph shows the supply and demand curves labeled S and D respectively. The horizontal axis is labeled ‘Quantity of labor’ in units of thousands. The values range from 0 to 100 in increments of ten. The vertical axis is labeled ‘Wage rate’ in dollars. The values range from 0 to 20 in increments of two. The supply curve S is an upward sloping curve originating at point 0 of the horizontal and vertical axes. The demand curve D is a downward sloping curve originating at point 0 on the horizontal axis and 20 on the vertical axis. The line ends at point 100 on the horizontal axis and 0 on the vertical axis.
Level of employment: josiLJmKsvInBmqlCEcmKw==
Question
Labor force: K3K5jiMFaTV9RF1M0HRTbw==
Question
Unemployment rate: rZTab8OfHZ03ezas percent
Step 4
Question
If the concern for retaining workers and encouraging high-quality work leads firms to set a wage rate equal to $16, what will be the level of employment, the size of the labor force, and the unemployment rate?

The graph shows the supply and demand curves labeled S and D respectively. The horizontal axis is labeled ‘Quantity of labor’ in units of thousands. The values range from 0 to 100 in increments of ten. The vertical axis is labeled ‘Wage rate’ in dollars. The values range from 0 to 20 in increments of two. The supply curve S is an upward sloping curve originating at point 0 of the horizontal and vertical axes. The demand curve D is a downward sloping curve originating at point 0 on the horizontal axis and 20 on the vertical axis. The line ends at point 100 on the horizontal axis and 0 on the vertical axis.
Level of employment: HsY5/FLkfTciRjy2Gqg34g==
Question
Labor force: 86lkhjXE6cSvY4pmYMEsiw==
Question
Unemployment rate: 0dsJzZQP2WYTbkqC percent