Chapter 1. Chapter 9(24)
Step 1
Question
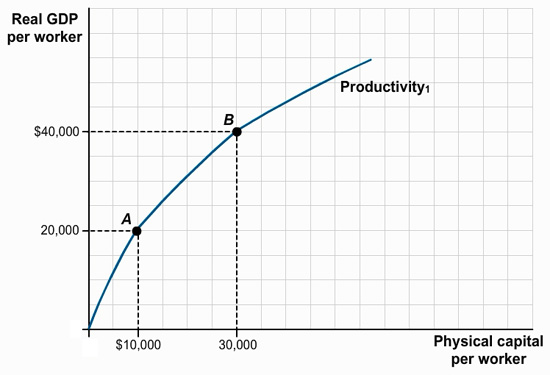
You are hired as an economic consultant to the countries of Albernia and Brittania. Each country’s current relationship between physical capital per worker and output per worker is given by the curve labeled “Productivity1” in the accompanying diagram. Albernia is at point A and Brittania is at point B.

The graph shows the Productivity curve that originates at the intersection of the horizontal and vertical axes. The horizontal axis is labeled ‘Physical capital per worker’. The vertical axis is labeled ‘Real GDP per worker’. There are two points, A and B, indicated on the productivity curve. Point A corresponds to a value of 10,000 dollars on the horizontal axis and 20,000 dollars on the vertical axis. Point B corresponds to a value of 30,000 dollars on the horizontal axis and 40,000 dollars on the vertical axis.
Step 2
Question
JD4A4tZ+js+3W+orV1bBhk2eAimnNC/b/Fybb+9Eqhbz6Z0RIR/9OpM+yN5I7QU0Z6Fwa5wk0rlDKE1XmID8vm/jGSB/lSVpjKxcf7AeKcHrYFqBiY+uy+4I+BN+Y4g98EZn4nnjXB3hERVyxfXf7+57lyczdq98XV2ruNZfl5uAJlOJGmmSQKxtbaIAi1A3q7b2X+L0hIxCHUR94jauP4ENKV9uXNKxwdbHG18W8uF4quoskaWGbNHlCacSeNlW/fHUahn9jL+bht6vbKdf2YdtCeGlpFVIHXQe7TrqfEJujWjB3JH6NF8XBGWpzkZT95e6GVxVKObizjyi+O20Ui2GYyhphOX6XphUezBzqgfJcZLkcbkIri3MP2vH5Ww1Nw2XIjTeSRuAtEQ+8QM3Vb1ppavnMexHcCLjeSv0xitXxg6vTKGSllEj2erKHI9t6Zx5biByZEdtEKj8ONcuHHU8iSEJshoP9xJmBFvqz+US1KSUBI2PiYxTKF+8xzd+GXnTUlxAqvDar8lIZLBrxo5LQEEdOZfCSzOU3AsTQBqrfGaWUc+e5ewyfqZCAISL+QOFoA2B+mIu8d7nBByWNOv45KxgUzgdmE8GUlv8P+g3ftajSFUbEiU/Yp5mpooO63b4szUf4ASb1XfiBc2EsLzr1LoW3X97KsVycbYH6Zw7v3D+1dM1Od3Ga0D5jnQdbXV66pYkvfD5azR+fDFSBwgvujUeFKS6eGxWbfBVyafWDVWaK39OnD7BnJxj5alPDrVu83L1G6/fz2qPG7r2jjEsIHC75ZYgGrXkW3jHvSlM2N3kckhz64Ng4iv8dfYlq70fLXBriu33KK2wuR2p84WCNyeNzMmyMR3UeseLPbtij60uMd2J17mvQNCmA/bCMYYqzZezzW27xW+A4ciXc2cv/mGJhhaUsa4u0nRcS6cWgZUVDNOVcRPTlkEPfd/jEstqgzBW3rUhO6sGASTRYDDcdrKKsHsA9WbEZV7aE8eR6RvHoKVwgZWFxyo5l+c6AAFHDHJkh3KoYieLJIqVNlGZdF88Ki/qBh5sfOiUjqk5egtXnxnfHlL+Ljw1zMax4pKbY/Le4b2WuBEfuLP+Cf+h76AtaDPNqqt/uHcM0visx7u8FlX+/0CXyzbxwqDR+6jOTeHRSUSNLMrifSe72mid0XVUH4sVoCLNwZeNgGCRMFT4Fn0T8TDxWdFN+eNKcR2KHzNGyw2Uj/J/4KAk7u9tFem8XasaAhOVhsVEceeplM+z+0ORkbiy6LX3t3M+E0FPDEDFfUcOtanVfCM1VCETlKKk4y7yo/ekW/leu/nHTBkhU4daewJXoYLjVNASc6GAAUuqqrheGmmIBBmr1Z49bKq0ADGgzgHMxed0vPZx0SkYxHFQUwKR6ToW+sdG6g6K6vOZ9niO2h2ymjq8NPBAkSJouBOWjZJTYWQF8ijGVN5olUptlCjlMG35UjQpvOLmPyv5vrVRbjLGi70dkVNqtnUoClbKlI6nW9bLl4FqXgCifrHDgTusP4FQfI09jy1d96oTH91PyEuCNQ9PAQMbxB8M/J4ZZK52TIxAO6WBmyjQQRmAkrAB2/7bmdgWpCqtabq2m95NXONiq9KluwSp11k0NnDjtOpDOJAvA+zdf8bIBbg+Xa9GLDvll/1cth5H9/4GzIL2Djv2ltIlHrHsVx5hz8NnKw5FPBuWyTX5b2AUh4P3GaEpaQkWrjvy4K6GABPJEoqPv16qdCeg1pOH6Qk80RSEiPxtvNH61pZuNYndSpNODeCSnNsHUEU+KHxjxePbdiOGW/3Tap3yq0NCC3NGF2menPhVHsESuUdDWw1tSfMLAesHndYN4JLoNRhUMtpVD64E6r/yC2CbyVlszLUl2LLDDxdsgNmtAlat0HSmAjfPlqfX0ZCkxy7l0qthP8954uSW5eAxszAd+zfUq1mFeV8FY6Qo3DcarWKI+SEAJBdeDMRANsvYTgBxrKfvC4L/p77p6fTIA+Jnsaqp3LbWdwuIdQuTl87kzIvofYXdFyX7cYDJ2yoVPN7GIS65I99b7PJ8isyM/pLIjV0QYoNcHq2V0N6zDgYK/8O0AY7H77FlI2UejK8R273aI+d8PnWmJ/ViKV+v5hll61m0O2A7PBHNsiLGpQnuAU7Nlcuqc9Y3G1O63YpQTV7o+ydk/eGdCcHURA5SyDaGS/EPAVFUq7RJUphFUOwYpmC+0O+7tqiCdXJhMaKq4RTyxD1VZq6yWL/zJclQQUIZdNkh3hOtQIV5V2lBuFbMLct1FvVzYpSebmps+InxNgjCh7Um7x7BJFIlf9pZAuu/wRaVFCCTCuXtsbhOzAifa7D9Ef0TNk5NQtWI/x2ezTZqBIBkDlgh44+ybq9GPjL7o6RwhdKmLYBZtIYOuZkDGxZu77GG/nbNeXlJfWmYASgYg4hQndjkKB1pkM8TikJwQPm/+uqagX/mhHBtFwu9NeVwI7L05kyQr9+tE+GAyWYcyq41mXekzv0Q1XRCGADO/uwilIU4T4WQYOZhUPL7gO10blkP4p5KtRwT9TJmKb0AzNS2Rb9GoCfPjheG8OmUk/F6INBtInzEJ7zbOoRdU3PXp+uNBs8XjreBHzmCxBEk/zxOoXcjhvhRWZcY9xw4RtgieirShII7dFEqPLDSIDyz7hgaGN9KCdGRnGH1J2CgA7EI8qu+TT3gjWrnPYJOYlh8tKYbMtndSSJ0LHoHkAQrtjkpu3txW++ccCdmer7fMhVZJKQ7YKOzBI6d7/Fn9cRHyJSSftBcCV3ogyI17isg+X70wdcvByJG46CqXFI6G4TrJqJ0P9MQW3JkqEmIHsA8uLZTNy3tEaiAOgTOAV8DXVocHe+nRx1GgOnSjKGFfHzfDC3mFn9AoFgRfqkJiK5yJRJVUzQp59pZmXdIl8QB3ML/4lLK4ald/95mRrGA3zcGblHFen4fmltZnYg697bUErZxNrC9vyUTUqSPC/MEC2oMJzZmcDN4Qtxi/JIyGerbFkJqBkvUkyJThkuUpQKifqFyaJcWqHb2ofw6m3aJFdmnwlHenICYh0s=The graph shows the Productivity curve that originates at the intersection of the horizontal and vertical axes. The horizontal axis is labeled ‘Physical capital per worker’. The vertical axis is labeled ‘Real GDP per worker’. There are two points, A and B, indicated on the productivity curve. Point A corresponds to a value of 10,000 dollars on the horizontal axis and 20,000 dollars on the vertical axis. Point B corresponds to a value of 30,000 dollars on the horizontal axis and 40,000 dollars on the vertical axis.
Step 3
Question
GqUmtowhLJiMD4rYA2fS786mEl8sC96Pu4ZRM5Ja/SQVQa5hnGtkdxThCFeiHBYM1TVjgJhOBMlQvsZOSOWvIBFFKQgmwiL3uZkDBqbILgVOji9+gI3CBpwFPNjZ/Ryqwu/d8le0Erb+kA/b+ADRhEJycNOpQT0T7oHpma59asESPZ71ijXspPk8zPODrVpwSfqY/wOJM7W35luzBcy1mth7WOszM5Js3wfRg5QEmifWU/xITNX4En2Xpac5KuzbO0RYfcagWXDSMXgB36bUfJ5tBAe46dW5gjr2Lz3RTo246QhkfT6qmzeClHqmTM+uWItnTXDAAErHWzoRzh/+ReETc1sPlyDJreCPYx23F7LAITHuMP3jaF6vB1FXa5S0LsCwTUrXuHAWQpnwpsQMJMJ+Lo7VB0nuboFGl+mJG2pEXnC1ljzjXUKvgvQKi1b0dWR+v6xsWbVdUyooVoPgMnrWUPH+1e5tLBzIQ3ZmeQqJn320ZQ0y/ScbTg02AhF0htEIOd3K+jo5zNiF7ouD39aS5vVk8WMx8+6dU91DZg0cL7ZVw7Fdcfnke9nQwHDmDk/2TcEszY++qc9/Q+9IBCfeY+C9Nm7EYHy0oi99LzxImMirvcC8oRzExmXNGNUWa0nfnvw3tYWyLuJsSKrZQuqY68qvAxoHmlB3md/7Hs3T/kLj+qHEB+hedKIAsgY1GDHWYhz9y/aVDEX3xvJOtP78Zb9wKxVhTCIcP9/B6oOaFMN3pejbN3O6jS8zgH7tdQSC7r3A0AQxr9+FhEKjPug73EZQkXYe5JEQoCNSrhuXUIOMXxC5lOemR+zboYfHGPcQLL7ivxuiWBFhYuCg0jsUt/BHXMBVuZf6hoFVP/neNANqSMUDC4QSgks1P4uD48ni555bfQqsGw83K3TL7UbxVtoKVyD91gv6zU7dSN/Hio7HkEnBvZ6ZWr/eW5alWgWaaQP9yz1EIIET9Mw6hxLDmGHTr+JVH5BPbhM33rhXUKuXXXi8T/oir6WN5KgUsbgT5dRV9fRF8kk0KJnfwGKUO583sbcIM7FaW9X6O7zW2m+NjVEUjBuonYLGjXLmLXICF2ZW4tEBywYWqEakj5JXMtb8pBg4puc9Pn9giNdekjshGJ9uqUO7NbqGeYiQRL/MPnCOP3G5hthZCXmlXjcJ/HOD+R5aOOvKex27icEzRJqXomsH3JIr4uXJcx28VsIzGgrxuh+nF8SroGJuELTeeGnZkdATYAsbM13uKDvJsIPzuiZN+fMJgkcI/HLAVx+cz6cs7DeqiXyQ+bmRx5PEzjZh0bo+KlxhdHhYm88AcY2rbzP7W02eTTjucKtKet/9Cjo+VPRHBY10RNTBDwe21lu/FnwvuPEgcHmgG5WDx6O80pO2EpMiTXTsEbAftnB9ZV3v7T9mG2l+E6aLr4viZGwm73O311U0hvF4KKMvdDfUaAbbpupi+mDogYFSZMUzSLIyPqD/rsOFBjTfugeJWLJsPbUTqvxuLl8p4WksWQtVYncEsPl4vRVyqKJEKjfpXjM/6DgRnh8v6s/WfLbEsO4PFEGr/ETj9UdgZVm0InKYUr9Un086DziBDgHCuaOo0V67mBM9eGL4vBf6eZx+tiU6ckc1deAOv8qNzsW9ESVSGzGQNqWOo/mhmeYSKitMZNvPKyRnFOQDfvYEsJqM46YYmyswUuL6GzrBCC/KtWPiE3uGe/+KbqdxXcE0dtx+5U1icE6Q+HNvcpb/SNt1kZhPAcSzZe7hePfaLZ8V8WQl+jNedEPZWoiWZCYpgVKa51n57Ddk+oEiPkVu3Oj1cYubC0qe/IFRI0WaMgyV9i1iKeEpYabVtpNhNFxrGHskMRmVB3skknaDyIU4H3pXzf63+4HAnaEbRcsoAOhNP2xviRc64IJulzZg44Gc6gqiemNfDqpN/9emagHIWDmkyY8wIiLgOCRRToHcP+tJ3xpDDrMj3syEtDuUfDrv9bL61xYlaWkoFxhdn29Fjb1BmuRU5eVa0oARZtHIRfr2k6uGaclkFNM/M9ZRbfEDfnm1uK14XYl72cx9wmEz9F8Q/RLtoJti4l6rm7YI586sXm6C0vXrleBU1FgKAXBivlDeGN9HKvUfdcHBUmm7qrxZiU1iA4YSRuYyVybseREloTbq8zqI9RS5WH0IEsCTxsnaJJvkAHxD/sI4sYAXXdAMhM4kTQARo0R/Y1TCVw3cT2szSPxqy3ikmuSJ2Z1XClOZs7AAUxFrdXEyO0yGjWzncRoF9tj6SaC81mQbPI1EGxOx5sljk0Btf8SuxksCSOXEO5I9vfhj15llRqCZRGUyMGkDqYAtRhlJTT3jbHTjMmxRbeO7893Wr5B7GXaNB3ZvEakUNyt0P3w+XOZkV8bcw8BHi2Y3RQlIT4CPAJs15uQZx3IrxnIpZEdMHthHaceTLXdnE4ZqOYzNOknW/sNTX1B1tQDPtZkUr6mSl2kgSXpnO6LAHm3B4taeJQnFRW3p/FOxsKgtuhu2larEWynnOzmWQYEboSOwK/DUaiLQX/hR5eyuKmm2OpZI5/y3IKqQIT4Gu0VbYg2cyCMAfbNZpPRO/d3m96iNT6LUV6Fr/jdOKbO32VQioX6VQ/TJDHOtJS+UnnnZ2h07NEDloTmzj9gY0WEu/9iVp2kTlAKq6fxDUHL5Ia5YMkH25OgzVW54kvULzZH+nsrUujXrS6eNMmgO17Td5KTnzClZrqLZUXUbIfLBAkLDaujRveZrN3mAHe+rcQbCJkTvfndPdKur9F9fNcYK6+O/awbv0xujd+rNb1ZlY5nYyFZrXTgJoWF8W04Nmd+IeMuu3r/eiVpxrXYHhdWffL+GjK7hZSh4J5gVlZ13fxp/eJYrxw95THswI5BBiCBDE43XmZjcaMamAlUVYsrKg9O4QQrid/OihrjvlUGBUymD/DyokgejUIt0f2Bg1rth3FVyArAKNU7CkuBiD9744LYrkv1uamqGCs5xD6P9RjYBF0+GoUumA5gHC8x/a9x2p/bOSnVkvdq5z8r8sxtBsYKma1GRfWxfQ9SuLzN39vQUF5JLaQVczT2qnSwPSoRaWl0453cusNMMQ/KhetGLFJDcN7orCWuLrehdfUYc42S3L46dgarLJdAHeneqZ/4HB48Vn0scHPunsWLaMdJBRg8HrbJgVykZvGma/owaHdnPzjnshUpGXgiU7Ag9Nm2Bc7jmH1nD5y8KyBgW12/FE9qLpDB2wFT7O0J6g77Ie94GSS3GfKRSGW7Njs8MiJAH5CQbs4zOi5Pfga573amhx2Ap6aLy/PutXf5+GRTcpI1CnFi7AxFK3YomIwG7rj3bqLNzHgqr+m0d6PMrTaoauEeKkBvRh1X6HVB6k3erf+RyoIKRny+vd76JZIrYMZ2MutWQJz7oc/uqxBW+hUoOjZdp1/wn6KzMB5bTvIOts0fpbjeNS8qwUPO1x9FipNpQRcwQuSVnACkbrBgPn7R78DdyltNJe+d9DJsXqInKAw+pGo8WVgXk/5he2TsgPofK6ixc2izlbv4w/av9AWHsm0ZDiqq6UJymgHMyoIJ8LKeVYH8Q7mAph+RxAr1i7SZiX1Co4IGGxrNUuB6s0MA4m85nhMmlRB/w4yHhRnt6exm1epLJ41tklDzUZ3O03nk2wjSQ9Q7rzh5mw3A2yj4M+07dY0iUicnFeP/t91XrHXX++1dTeBJlwvN7hg==The graph shows two Productivity curves (Productivity 1 and Productivity 2) that originate at the intersection of the horizontal and vertical axes. The horizontal axis is labeled ‘Physical capital per worker’. The vertical axis is labeled ‘Real GDP per worker’. There are two points, A and B, indicated on Productivity 1. Point A corresponds to a value of 10,000 dollars on the horizontal axis and 20,000 dollars on the vertical axis. Point B corresponds to a value of 30,000 dollars on the horizontal axis and 40,000 dollars on the vertical axis. Point C is indicated on the second productivity curve (Productivity 2) and corresponds to a value of 10,000 dollars on the horizontal axis and 40,000 dollars on the vertical axis. The space between the two curves is indicated by a vertical arrow.