Question 1 of 3
Step 1
The accompanying table gives the annual U.S. demand and supply schedules for pickup trucks.
| Price of truck | Quantity of trucks demanded (millions) | Quantity of trucks supplied (millions) |
|---|---|---|
| $20,000 | 20 | 14 |
| 25,000 | 18 | 15 |
| 30,000 | 16 | 16 |
| 35,000 | 14 | 17 |
| 40,000 | 12 | 18 |
Using the data from the table, find the equilibrium price and quantity.
- Chapters
- descriptions off, selected
- captions settings, opens captions settings dialog
- captions off, selected
- English Captions
This is a modal window.
Beginning of dialog window. Escape will cancel and close the window.
End of dialog window.
This is a modal window. This modal can be closed by pressing the Escape key or activating the close button.
This is a modal window.
Step 2
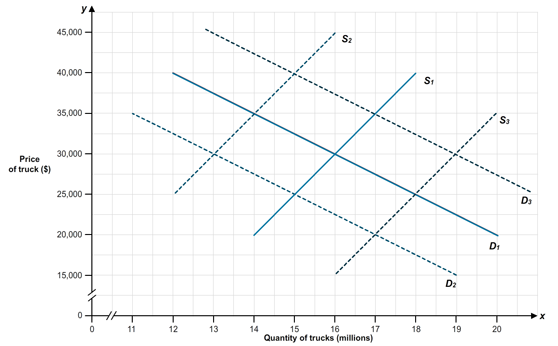
Suppose the tires used on pickup trucks are found to be defective. Using the following graph, what do you expect will happen to demand and supply in the market for pickup trucks?
- Chapters
- descriptions off, selected
- captions settings, opens captions settings dialog
- captions off, selected
- English Captions
This is a modal window.
Beginning of dialog window. Escape will cancel and close the window.
End of dialog window.
This is a modal window. This modal can be closed by pressing the Escape key or activating the close button.
This is a modal window.
Step 3
Suppose that the U. S. Department of Transportation imposes costly regulations on manufacturers that cause them to reduce supply by one- third at any given price. Calculate the new supply schedule by filling in the blanks in this table (quantities should include one decimal place, i.e. 15.0). Based on your findings, identify the new equilibrium price and the new equilibrium quantity.
| Price of truck | Quantity of trucks demanded (millions) | Quantity of trucks supplied (millions) | Quantity of trucks supplied after regulations (millions) |
|---|---|---|---|
| $20,000 | 20 | 14 | |
| 25,000 | 18 | 15 | |
| 30,000 | 16 | 16 | |
| 35,000 | 14 | 17 | |
| 40,000 | 12 | 18 |
The new equilibrium price is $ . (no decimals)
The new equilibrium quantity is million. (no decimals)
- Chapters
- descriptions off, selected
- captions settings, opens captions settings dialog
- captions off, selected
- English Captions
This is a modal window.
Beginning of dialog window. Escape will cancel and close the window.
End of dialog window.
This is a modal window. This modal can be closed by pressing the Escape key or activating the close button.
This is a modal window.