Chapter 1. Chapter 14

Step 1

Work It Out
true
true
You must read each slide, and complete any questions on the slide, in sequence.

Question

There is only one labor market in Profunctia. All workers have the same skills, and all firms hire workers with these skills. Use the accompanying diagram, which shows the supply of and demand for labor, to answer the following questions.
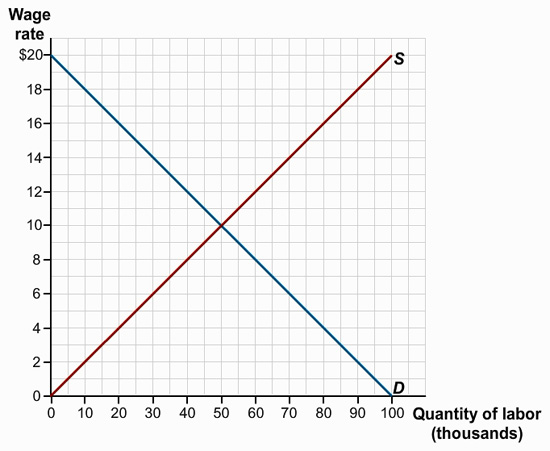
The graph shows the supply and demand curves labeled S and D respectively. The horizontal axis is labeled ‘Quantity of labor’ in units of thousands. The values range from 0 to 100 in increments of ten. The vertical axis is labeled ‘Wage rate’ in dollars. The values range from 0 to 20 in increments of two. The supply curve S is an upward sloping curve originating at point 0 of the horizontal and vertical axes. The demand curve D is a downward sloping curve originating at point 0 on the horizontal axis and 20 on the vertical axis. The line ends at point 100 on the horizontal axis and 0 on the vertical axis.

What is the equilibrium wage rate in Profunctia? At this wage rate, what are the level of employment, the size of the labor force, and the unemployment rate?

Equilibrium wage: $ Pz2PEfhsNWI=

The equilibrium wage is the wage rate where labor demand equals labor supply. In the graph above you can see this equilibrium occurs at a wage rate of $10. For further review see section, “The Unemployment Rate.”
What is the equilibrium wage rate in Profunctia?

Question

Level of employment: 8o7nxaA23zDZj8oYN+RB2g==

The level of employment is equivalent to the equilibrium quantity of labor. In the graph above you can see that in equilibrium there will be 50,000 people employed. For further review see section, “The Unemployment Rate.”
At this wage rate, what is the level of employment?

Question

Labor force: 8o7nxaA23zDZj8oYN+RB2g==

The labor force is the sum of employed plus unemployed. Using the graph above you will see that there are zero people unemployed. By definition, an unemployed individual is someone willing to work at the market wage. When the labor market is in equilibrium, everyone that is willing to work for the market wage, $10, is able to find a job. If there is no one unemployed then the labor force will be equal to the total employed or 50,000. For further review see section, “The Unemployment Rate.”
At this wage rate, what is the size of the labor force?

Question

Unemployment rate: 78YzBHhvBzA50GXZ percent

The unemployment rate is defined as the total number of people unemployed divided by the labor force. Since the labor market is in equilibrium there is no one unemployed. This means the unemployment rate is zero percent. For further review see section, “The Unemployment Rate.”
At this wage rate, what is the unemployment rate?
0:56

Step 2

Question

If the government of Profunctia sets a minimum wage equal to $12, what will be the level of employment, the size of the labor force, and the unemployment rate?

The graph shows the supply and demand curves labeled S and D respectively. The horizontal axis is labeled ‘Quantity of labor’ in units of thousands. The values range from 0 to 100 in increments of ten. The vertical axis is labeled ‘Wage rate’ in dollars. The values range from 0 to 20 in increments of two. The supply curve S is an upward sloping curve originating at point 0 of the horizontal and vertical axes. The demand curve D is a downward sloping curve originating at point 0 on the horizontal axis and 20 on the vertical axis. The line ends at point 100 on the horizontal axis and 0 on the vertical axis.

Level of employment: oOWeJMckLq0qBmOfVf/uJg==

At a wage rate of $12, the quantity of labor supply will increase but the quantity of labor demand will decrease. To find the level of employment you need to determine how many workers firms will hire at a wage of $12. Using the graph above you can see that at a wage rate of $12 there will be 40,000 people employed.The point on the labor demand schedule that corresponds with a wage of $12. For further review see section, “Structural Unemployment.”
If the government of Profunctia sets a minimum wage equal to $12, what will be the level of employment?

Question

Labor force: 3N1zdPKp0pHkYn9M6ec4vQ==

The labor force is the sum of employed plus unemployed. In the previous part you found the level of employment as 40,000, but now that the wage rate is higher more people are willing to work. In fact, at a wage rate of $12 there are 60,000 people willing to work. The labor force is the same as the quantity of labor supplied at a wage rate of $12. For further review see section, “Structural Unemployment.”
If the government of Profunctia sets a minimum wage equal to $12, what will be the size of the labor force?

Question

Unemployment rate: /rGox/IeBhAB82Tc percent

The unemployment rate is defined as the total number of people unemployed divided by the labor force. At a wage rate of $12 there will be an excess supply of labor. In the graph above we can see that at a wage of $12 there will be 40,000 people employed but 60,000 people willing to work. Thus, there will be 20,000 people unemployed. The unemployment rate will be 33.3% ((20,000/60,000) x100). For further review see section, “Structural Unemployment.”
If the government of Profunctia sets a minimum wage equal to $12, what will be the unemployment rate?
1:37

Step 3

Question

If unions bargain with the firms in Profunctia and set a wage rate equal to $14, what will be the level of employment, the size of the labor force, and the unemployment rate?

The graph shows the supply and demand curves labeled S and D respectively. The horizontal axis is labeled ‘Quantity of labor’ in units of thousands. The values range from 0 to 100 in increments of ten. The vertical axis is labeled ‘Wage rate’ in dollars. The values range from 0 to 20 in increments of two. The supply curve S is an upward sloping curve originating at point 0 of the horizontal and vertical axes. The demand curve D is a downward sloping curve originating at point 0 on the horizontal axis and 20 on the vertical axis. The line ends at point 100 on the horizontal axis and 0 on the vertical axis.

Level of employment: josiLJmKsvInBmqlCEcmKw==

At a wage rate of $14, the quantity of labor supply will increase but the quantity of labor demand will decrease. To find the level of employment you need to determine how many workers firms will hire at a wage of $14. Using the graph above you can see that at a wage rate of $14 there will be 30,000 people employed. For further review see section, “Structural Unemployment.”
If unions bargain with the firms in Profunctia and set a wage rate equal to $14, what will be the level of employment?

Question

Labor force: K3K5jiMFaTV9RF1M0HRTbw==

The labor force is the sum of employed plus unemployed. In the previous part you found the level of employment as 30,000, but now that the wage rate is higher more people are willing to work. In fact, at a wage rate of $14 there are 70,000 people willing to work. The labor force is the same as the quantity of labor supplied at a wage rate of $14. For further review see section, “Structural Unemployment.”
If unions bargain with the firms in Profunctia and set a wage rate equal to $14, what will be the size of the labor force?

Question

Unemployment rate: rZTab8OfHZ03ezas percent

The unemployment rate is defined as the total number of people unemployed divided by the labor force. At a wage rate of $14 there will be an excess supply of labor. In the graph above we can see that at a wage of $14 there will be 30,000 people employed but 70,000 people willing to work. Thus, there will be 40,000 people unemployed. The unemployment rate will be 57.1% ((40,000/70,000) x100). For further review see section, “Structural Unemployment.”
If unions bargain with the firms in Profunctia and set a wage rate equal to $14, what will be the unemployment rate?
1:37

Step 4

Question

If the concern for retaining workers and encouraging high-quality work leads firms to set a wage rate equal to $16, what will be the level of employment, the size of the labor force, and the unemployment rate?

The graph shows the supply and demand curves labeled S and D respectively. The horizontal axis is labeled ‘Quantity of labor’ in units of thousands. The values range from 0 to 100 in increments of ten. The vertical axis is labeled ‘Wage rate’ in dollars. The values range from 0 to 20 in increments of two. The supply curve S is an upward sloping curve originating at point 0 of the horizontal and vertical axes. The demand curve D is a downward sloping curve originating at point 0 on the horizontal axis and 20 on the vertical axis. The line ends at point 100 on the horizontal axis and 0 on the vertical axis.

Level of employment: HsY5/FLkfTciRjy2Gqg34g==

At a wage rate of $16, the quantity of labor supply will increase but the quantity of labor demand will decrease. To find the level of employment you need to determine how many workers firms will hire at a wage of $16. Using the graph above you can see that at a wage rate of $16 there will be 20,000 people employed. For further review see section, “Structural Unemployment.”
If the concern for retaining workers and encouraging high-quality work leads firms to set a wage rate equal to $16, what will be the level of employment?

Question

Labor force: 86lkhjXE6cSvY4pmYMEsiw==

The labor force is the sum of employed plus unemployed. In the previous part you found the level of employment as 20,000, but now that the wage rate is higher more people are willing to work. In fact, at a wage rate of $16 there are 80,000 people willing to work. The labor force is the same as the quantity of labor supplied at a wage rate of $16. For further review see section, “Structural Unemployment.”
If the concern for retaining workers and encouraging high-quality work leads firms to set a wage rate equal to $16, what will be the size of the labor force?

Question

Unemployment rate: 0dsJzZQP2WYTbkqC percent

The unemployment rate is defined as the total number of people unemployed divided by the labor force. At a wage rate of $16 there will be an excess supply of labor. In the graph above we can see that at a wage of $16 there will be 20,000 people employed but 80,000 people willing to work. Thus, there will be 60,000 people unemployed. The unemployment rate will be 75.0% ((60,000/80,000) x100). For further review see section, “Structural Unemployment.”
If the concern for retaining workers and encouraging high-quality work leads firms to set a wage rate equal to $16, what will be the unemployment rate?
1:40