TABLE OF CONTENTS

Question 1 of 3

Work It Out
true
true
You must read each slide, and complete any questions on the slide, in sequence.

Consider the economy of Wiknam.

The consumption function is given by

C = 200 + 0.75(YT).

The investment function is

I = 200 – 25r.

Government purchases and taxes are both 100. For this economy, choose the correct graph of the IS curve for r ranging from 0 to 8.

Review Chapter 11 pages 324-325, along with Figure 11-7, for a discussion of how to derive the IS curve. Review pages 330-331, along with Figure 11-11, for a discussion of how to derive the LM curve. Review pages 332-334, along with Figure 11-13, for a discussion of how to solve the ISLM model for the equilibrium interest rate and level of income.

The money demand function in Wiknam is

(M/P)d = Y – 100r.

The money supply M is 1,000 and the price level P is 2. Choose the correct graph of the LM curve for r ranging from 0 to 8.

Review Chapter 11 pages 324-325, along with Figure 11-7, for a discussion of how to derive the IS curve. Review pages 330-331, along with Figure 11-11, for a discussion of how to derive the LM curve. Review pages 332-334, along with Figure 11-13, for a discussion of how to solve the ISLM model for the equilibrium interest rate and level of income.

Find the equilibrium interest rate, r, and the equilibrium level of income Y.

The equilibrium interest rate, r, = %

The equilibrium level of income, Y, =

Review Chapter 11 pages 324-325, along with Figure 11-7, for a discussion of how to derive the IS curve. Review pages 330-331, along with Figure 11-11, for a discussion of how to derive the LM curve. Review pages 332-334, along with Figure 11-13, for a discussion of how to solve the ISLM model for the equilibrium interest rate and level of income.
WIO_Mankiw_Chapter12_Question03_01
Video Player is loading.
Current Time 0:00
Duration 0:00
Loaded: 0%
Stream Type LIVE
Remaining Time 0:00
 
1x
    • Chapters
    • descriptions off, selected

      Consider the economy of Wiknam.

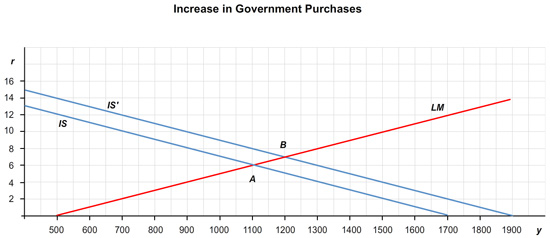
      Suppose that government purchases are increased from 100 to 150. How does the IS curve shift? What are the new equilibrium interest rate and level of income? (Hint: You will need to draw this graphically to answer these questions.)

      The IS curve shifts to the by .

      The equilibrium interest rate, r, = %.

      The equilibrium level of income, Y, = .

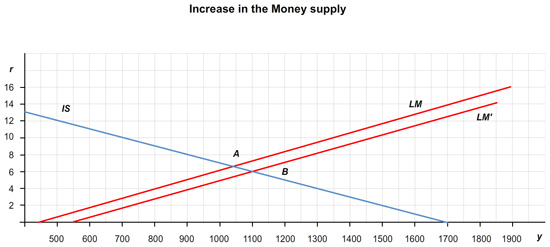
      Suppose instead that the money supply is increased from 1,000 to 1,200. How does the LM curve shift? What are the new equilibrium interest rate and level of income? (Hint: You will need to draw this graphically to answer these questions.)

      The LM curve shifts to the by .

      The equilibrium interest rate, r, = %.

      The equilibrium level of income, Y, = .

      WIO_Mankiw_Chapter12_Question03_02
      Video Player is loading.
      Current Time 0:00
      Duration 0:00
      Loaded: 0%
      Stream Type LIVE
      Remaining Time 0:00
       
      1x
        • Chapters
        • descriptions off, selected

          Consider the economy of Wiknam.

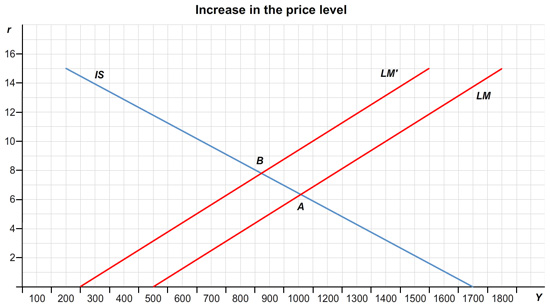
          With the initial values for monetary and fiscal policy, suppose that the price level rises from 2 to 4. What happens? What are the new equilibrium interest rate and level of income?

          The LM curve shifts to the by as shown in the graph.

          The equilibrium interest rate, r, = %

          The equilibrium level of income, Y, = .

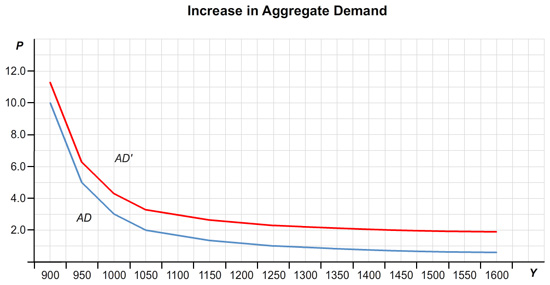
          Below is the graph for the aggregate demand curve for the initial values of 1000 for the money supply, 100 for government purchases, and 100 for taxes. What happens to this aggregate demand curve if fiscal or monetary policy changes, as in parts (d) and (e)?

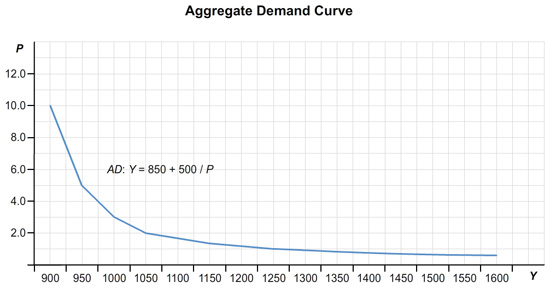
          An increase in government purchases will shift the aggregate demand curve to the . An increase in the money supply will shift the aggregate demand curve to the .

          Review Chapter 12 pages 346-350, along with Figure 12-5, for a discussion of how to derive the aggregate demand curve from the ISLM model. See Figure 12-6 for details of how changes in fiscal and monetary policy shift the aggregate demand curve. A shift to the right in the aggregate demand curve is shown in the graph below.

          Review Chapter 12 pages 346-350, along with Figure 12-5, for a discussion of how to derive the aggregate demand curve from the ISLM model. See Figure 12-6 for details of how changes in fiscal and monetary policy shift the aggregate demand curve. A shift to the right in the aggregate demand curve is shown in the graph below.

          WIO_Mankiw_Chapter12_Question03_03
          Video Player is loading.
          Current Time 0:00
          Duration 0:00
          Loaded: 0%
          Stream Type LIVE
          Remaining Time 0:00
           
          1x
            • Chapters
            • descriptions off, selected