Question 1 of 3
Step 1
An economy has the following equation for the Phillips curve:
π = Eπ – .75(u – 5)
People form expectations of inflation by taking a weighted average of the previous two years of inflation:
Eπ = 0.6 π–1 + 0.4 π–2
Okun’s law for this economy is:
(Y – Y–1)/Y–1 = 2.0 – 2.5 (u – u–1)
The economy begins at its natural rate of unemployment with a stable inflation rate of 8 percent.
What is the natural rate of unemployment for this economy?
The natural rate of unemployment = %.
Below is the graph of short-run tradeoff between inflation and unemployment that this economy faces. Give numerical values for the point where the economy begins. This will be point A on the graph.
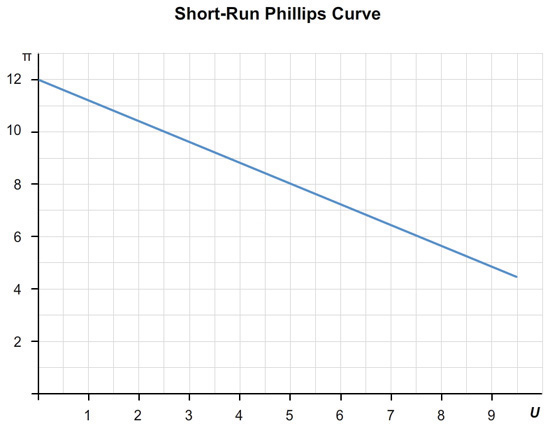
At point A, the inflation rate = % and the unemployment rate = %.
Step 2
An economy has the following equation for the Phillips curve:
π = Eπ – .75(u – 5)
People form expectations of inflation by taking a weighted average of the previous two years of inflation:
Eπ = 0.6 π–1 + 0.4 π–2
Okun’s law for this economy is:
(Y – Y–1)/Y–1 = 2.0 – 2.5 (u – u–1)
The economy begins at its natural rate of unemployment with a stable inflation rate of 8 percent.
A fall in aggregate demand leads to a recession, causing the unemployment rate to rise 2 percentage points above its natural rate. On your graph in part (a), label the point the economy experiences that year as point B. (Once again, be sure to give numerical values in the blanks below.)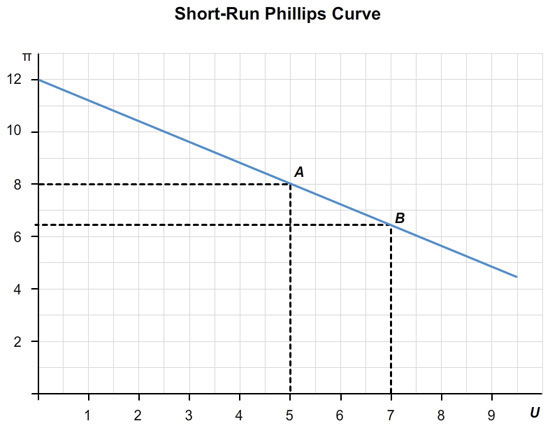
At point B, the inflation rate = % and the unemployment rate = %.
Unemployment remains at this high level for three years (the initial year described in part (c) and two more) after which it returns to its natural rate. Fill out the following table to show unemployment, inflation, expected inflation, and output growth for 10 years beginning two years before the recession. (These calculations are best done on a computer spreadsheet. Please round answers for unemployment and output growth to the nearest whole number. Round answers for inflation and expected inflation to one decimal place.)
| Year | Unemployment (u) | Inflation (π) | Expected Inflation (Eπ) | Output Growth [(Y − Y-1)/Y-2] | |
|---|---|---|---|---|---|
| 1 | |||||
| 2 | |||||
| 3 | |||||
| 4 | |||||
| 5 | |||||
| 6 | |||||
| 7 | |||||
| 8 | |||||
| 9 | |||||
| 10 |
Step 3
An economy has the following equation for the Phillips curve:
π = Eπ – .75(u – 5)
People form expectations of inflation by taking a weighted average of the previous two years of inflation:
Eπ = 0.6 π–1 + 0.4 π–2
Okun’s law for this economy is:
(Y – Y–1)/Y–1 = 2.0 – 2.5 (u – u–1)
The economy begins at its natural rate of unemployment with a stable inflation rate of 8 percent.
The graph below illustrates the short-run tradeoff the economy faces at the end of this 10-year period. Label the point where the economy finds itself as point C. (Again, with numerical values in the blanks below.)
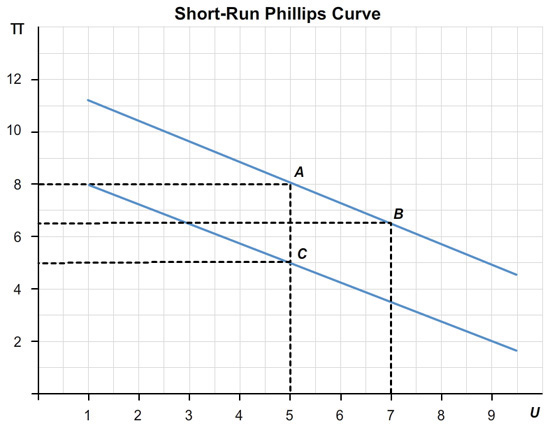
At point C, the inflation rate = % and the unemployment rate = %.
Comparing the equilibrium before the recession with the new long-run (period ten) equilibrium, how much does inflation change? (Note: Please round your answer to the nearest tenth.) How many percentage points of output are lost during the transition? What is this economy’s sacrifice ratio? (Note: Please round your answer to the nearest tenth.)
Inflation by percentage points.
percentage points of output are lost during the transition.
The sacrifice ratio equals .