Chapter 2. Writing Guide
Effective communication is a basic necessity in all professions. The most successful members of our society are those who communicate effectively. Scientists prepare research papers and publish them in scientific journals in standard formats. It is vital that you learn how to construct a well-written scientific paper. The techniques involved in organizing your thoughts and presenting them clearly will be an advantage in many different career paths. Effective communication should include sentence structure, grammar, spelling, and punctuation that are all correct and clear.
A scientist should also be able to use words in a precise and powerful manner to communicate clearly, correctly, and effectively. Above all, a scientific paper ought to be accurate, concise, and well organized.
Scientific writing does not come easy to many students because they often think that the end of an experiment is the end of the research; scientists know that this is not true. Scientific papers are written to communicate research findings and to provide other scientists with enough information to repeat and verify the work. This provides continuity in the scientific process, which is necessary to make advances. The writing and publishing of results is as much a part of science as the underlying research.
Typically, scientific papers or lab reports are divided into the following sections:
Title
Abstract
Introduction
Materials and Methods
Results
Discussion
Literature Cited
Title
The title of a scientific paper should convey, concisely, the fundamental nature of your research. The title must be constructed with care to communicate exactly what was done in the experiment. The title should be short and specific, but long enough to include all aspects of the research. Common and scientific names of any organism studied, the variable factor(s) manipulated, and the parameters measured should be included in the title. Superfluous and redundant words must be avoided.
An experiment to study the effects of light intensities on the rate of photosynthesis in Elodea sprigs could have the following title:
Note that the scientific name of the organism used is italicized.
Examples of poor titles include:
In a laboratory report, the title page includes the title of the report, the name of the student, the course name, the lab section and the instructor’s name, each on a separate line. It may be useful to wait until most of the laboratory report is written before writing the title. This will ensure that the essence of the research is reflected in the title.
Abstract
The abstract is a brief summary of the laboratory report or paper. The abstract is normally 250 words or less. It should include the hypothesis and a very brief background (from the introduction), how the experiment was done (from the materials and methods), the significant results (from the results), and conclusions (from the discussion). The abstract is written after the report or paper is completed and is written in past tense.
An example of an abstract from the aforementioned experiment may read as follows:
Introduction
The introduction is written in present tense and provides a general review of information on the subject of the experiment. It is common for the introduction section to start with the broadest statements about the area of the study and become more specific. The introduction should contain adequate material so that the objective and significance of the current experiment can be understood. The information from published works provides the framework from other experiments which are relevant to the research described in the report. Textbooks and scientific journals can serve as the basis for the information presented in the introduction. Supporting material for this section can also be drawn from the internet. Any websites used to gather this information should be trusted and reliable. Two primary groups of internet sites which can provide valid information are governmental websites and internet sites maintained by universities or other academic institutions. When possible, any information from internet sources should be verified. Scientific articles from online publications are cited as written journals if the electronic version is also available in print.
Citations should follow the sentence which contains the material referenced in the report. The reference citation includes the last name(s) of the author(s) and the date of the reference (see examples in the reference pre-lab).
When a citation has more than two authors, the last name of the first is listed, followed by et al. to indicate the additional authors. An example of this type of citation is:
Introductions to research papers also state the hypotheses which are being tested, as well as the scientific rationale for testing these hypotheses. The example study referred to in this appendix could have the following stated hypothesis:
The introduction may also include a statement on the purpose of the experiment, such as:
This example represents the full introduction section from the research paper referred to thus far:
Light is required for plant growth and survival. Plants have photosynthetic pigments that absorb light energy and convert it into chemical forms such as ATP. This process is called photosynthesis. The transduction of solar, or light, energy into chemical energy is often expressed in terms of carbon dioxide fixation, in which hexose is formed from carbon dioxide and oxygen is produced (Garrett and Grisham, 2010). A simplified version of the reaction can be written:
The first pathway of photosynthesis, called the light reactions, occurs in the thylakoid membranes of the grana. During these reactions light energy is absorbed by the photosynthetic pigments, mainly chlorophylls, and is used to form ATP and NADPH molecules (Raven et al. 1992). As a result, the oxygen atoms of water molecules in the chloroplasts are oxidized to produce O2 (Falkowski and Raven, 1997; Hill, 1939; Kirk, 1994). The oxygen produced during the light-driven reactions passes out of the stomata found in the lower surfaces of plant leaves. The second pathway of photosynthesis, called the Calvin-Benson cycle reactions, occurs in the stroma, a fluid-filled space. During these reactions, CO2 is fixed and reduced to sugar (Calvin, 1962). The energy to drive the second pathway comes from products of the first pathway. The rate of oxygen production can therefore be used to estimate the rate of photosynthesis (both pathways combined).
Reduced water clarity can affect submerged plants by reducing light intensity levels below those required for optimum growth. The required light intensity for growth is different for different plant species. Elodea canadensis is a plant which lives completely underwater. It is native to North America and grows in lakes, ponds and sheltered areas of rivers. It also is widely used in aquariums.
The purpose of this study is to determine the effect of light intensity on the rate of photosynthesis in Elodea canadensis sprigs as determined by the rate of oxygen bubble production. It is predicted that the rate of photosynthesis will increase as the light intensity increases. If this prediction is supported, then more oxygen bubbles will be produced at higher light intensities than at lower light intensities. The null hypothesis for this experiment is that there will be no difference in oxygen bubble production at different light intensities. The alternative hypothesis is that there will be a difference in oxygen bubble production at different light intensities. The data from this experiment will be discussed in terms of the clarity of water in the University Lake system.
Materials and Methods
The materials and methods section is not merely a list of what was used and the steps of the procedure. Instead, the section should be written in narrative form in the past tense. This section relates how the research was done and the specifics behind examining the hypotheses. The description of the experiments should provide ample details, including special equipment, procedures, and organisms, such that an independent researcher could repeat the experiments. Experimental details regarding the way measurements were made and data was collected should be included in this section. If different treatments or levels of treatment were a part of the research, they should be fully explained. If the experiments included field research, a detailed account of the conditions and the study site should be included in the methods.
Any factors that are related to analysis of the data, such as the number of replicates for each treatment and the type of statistics performed, should be explained. The independent variable (the factor which was altered, for example, light intensity) and the dependent variable (the parameter which was measured, for example, the production of oxygen) should be clearly identified.
Materials or methods that are standard in lab settings need not be addressed in this section (e.g., how to take readings with a thermometer should not be described unless the method was unusual). The specifics of the experiment are critical. For example, if a sample is heated slowly at first and then the temperature is increased, then simply saying “the sample was heated” is insufficient. If any material of a specific size or type is used for the experiment, then those details should be included. In addition, any equipment which is used in an unconventional or novel manner must be described completely.
A sample of the materials and method section from the example paper shown so far may look like this:
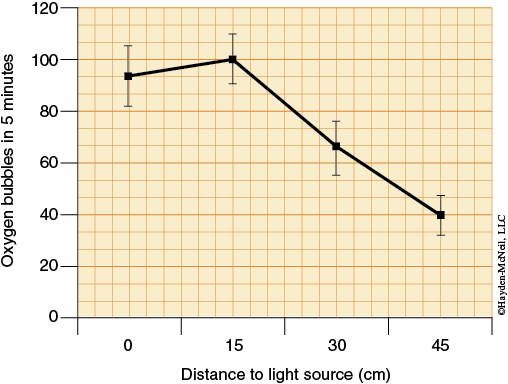
Measurement of oxygen production was performed using freshly obtained healthy Elodea canadensis sprigs (10–15 cm long). The bottom 1 cm of each sprig was removed by cutting diagonally with a razor blade. For each replicate, three E. canadensis sprigs were loosely tied to a glass rod and placed in separate 100-mL glass graduated cylinders with the cut ends upward. A total of three replicates were done for each distance from the light source. The sprigs were completely submerged in the cylinders in a freshly prepared pH 6.9 solution of 3% NaHCO3 (sodium bicarbonate). A 500-mL glass beaker of plain water was positioned adjacent to the cylinders to act as a heat absorber. Control cylinders were wrapped with aluminum foil to exclude light. A 200-watt light source was placed the indicated distance (0, 15, 30, and 45 cm) from the heat absorber and the light was turned on. After 15 minutes, the number of oxygen bubbles evolving from the cut ends of the sprigs in each cylinder in a 5-minute period were counted and recorded. The corrected number of oxygen bubbles was calculated by subtracting the number of bubbles formed in the control cylinder from those formed in the experimental cylinder.
Clarity of the water was determined by Secchi disk observations at two sites in the University Lakes system: the dock at University Lake, and the footbridge over Campus Lake. The Secchi disk was lowered straight down into the water until it could no longer be seen or until the disk hit the lake bottom. The disk was then slowly raised until the disk pattern was just visible and the rope was marked with a clip on the edge of the dock or at the water level. The disk was then raised to the water surface and the rope marked again in the same manner. The distance between the two markings was recorded in meters. Readings were done in duplicate.
Results
The results section should present the data from the experiments in several ways. Tables of the raw data collected are not shown. Instead, a table of transformed data with the means and relevant statistical parameters is presented. Graphs and other figures that represent the data and any trends are also included in this section. In addition, a verbal description of the data presented is required. This description should point out all of the tables, graphs and figures and describe all of the important trends or developments in the data. Any difference between treatments, which show statistical significance, should be pointed out in the text. However, a common mistake is to include explanations of what the data means. Those efforts will be taken up as part of the discussion section. Another good general guideline is that the results section encompasses what was measured (e.g., production of oxygen) whereas the discussion section refers to the biological process of interest, (e.g., photosynthesis). The results section is written in past tense and in paragraph form.
What follows is an example of the results section:
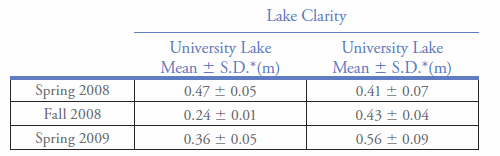
Water clarity was measured in two lakes in the University Lake system, University Lake and Campus Lake. Clarity was significantly less in University Lake than Campus Lake, except in the spring of 2008 when there was no statistical difference between the two lakes (Table 1). University Lake’s clarity was lower in the fall than in both spring measurement periods. Water clarity was greater during the fall of 2008 than in the spring of 2009. Seasonally, there were no statistically significant changes in water clarity for Campus Lake.
Table 1. Water Clarity in University and Campus Lakes in Spring and Fall.
Label formatting for the figures and tables must follow a standard configuration. The titles for tables are placed above the table. Figures (including graphs) have the title below the figure. While the figures and tables are referred to in the text of the materials and methods section each element should be clear enough so that it can be comprehended without referring to the text. If material could be presented in either a table or a graph you should not use both to present the same data. Graphs are inherently better for showing patterns or trends in the results. On the other hand, tables allow specific and precise values to be reported.
Discussion
The discussion section allows for a complete evaluation of the experimental results presented in the previous section. The evaluation should include any deductions and conclusions drawn from the data. The hypotheses stated in the introduction should be reiterated with explanation of which hypothesis is supported (and which is rejected) and why. Interpretations of patterns or trends shown in the results should be proposed and justified. Any aberrations or unexpected results should be discussed with possible sources for the causes suggested. Comparisons of the results with those from the literature should be developed when possible.
Be careful about drawing conclusions which are not fully supported by the data. If there are other possible explanations for the results, at least acknowledge them. Any weaknesses in the experiment design (not procedural errors) should be related in this section. In addition, if there are obvious suggestions for changes to make the experiment better, those should be included in the discussion section.
A certain amount of restricted creativity is used in writing the discussion section. Implications of the results in light of the literature and other experiments may be delved into in this section. At the same time, the discussion should not extend too far and certainly not beyond the framework of the introduction. The challenge is to show how the results of this experiment relate to the bigger picture.
The discussion section is written in paragraph form and in past tense. An example of the discussion section is shown below:
Plants need light to grow. The light intensity available for both terrestrial and aquatic plants is variable (Mazumder, 1998). Water clarity is one factor determining the light intensity which reaches Elodea canadensis. In this study we have shown that water clarity varies between lakes in the University lake system and also between seasons for University Lake. We have also shown that photosynthesis, as measured by oxygen bubble production, in E. canadensis occurs in a range of light intensities. The null hypothesis that there will be no difference in oxygen bubble production at different light intensities is rejected at the more reduced light intensities tested (30 and 45 cm distance).
Elodea canadensis was able to photosynthesize at all light intensities studied. Higher intensities, where the lamp was closer, did not always lead to significant differences in the rates of photosynthesis. This may be because the rate of photosynthesis was limited by other factors than light once the lamp was within 15 cm. Other factors could include temperature or nutrient availability (McKee et al., 2002). Light becomes a limiting factor when the light source is moved further from the plants, as photosynthesis is decreased. Reduction in photosynthesis would make it more difficult for the plant to grow. Comparisons of rates of oxygen production and growth of E. canadensis would also tell us if oxygen production is a good predictor of growth. More replicates might increase the power to detect differences. This may result in a significant difference being identified between the 0 and 15 cm distances.
Elodea canadensis could grow at deeper depths in the Campus Lake than in University Lake based on the water clarity. Also, it could grow in a larger range of depths in University Lake in the spring than in the fall. Many factors can influence water clarity, including plants. Invasive species of aquatic plants can so dominate an ecosystem that they can block most of the light (Masser, 2007). Some surface plants extend above the water, such as water lettuce or water hyacinth. These plants are aggressive and can grow to cover the surface and block light from even reaching the surface of the lakes (Masser, 2009). Both of these plants are present in the University Lake system. Large aquatic plants were not seen at the test sites, but algae were present as indicated by the green tint to the water and chlorophyll tests (data not shown).
Further tests could compare the light intensities in the photosynthesis experiment with light intensities at various water depths of the lakes. These measurements would help determine if light intensity in the lakes is limiting for photosynthesis by E. canadensis. This would determine if water clarity changes in the University Lake system would cause changes in light intensity that could limit E. canadensis photosynthesis and therefore limit growth.
Literature Cited
Any references included in the paper should be listed in this section. Every scientific publication has its specific format for citations, both in the body of the paper and in the literature cited section. In addition, different types of cited works have specific formats which are used. Listed here are some examples of citations.
Scientific Journal
The citation lists the last name of the author, followed by the initials of that author and then initials and last names of any additional authors. After the names comes the publication year. This is followed by the article title, journal name in italics, journal volume number (or if there is no volume number, the month), and the page numbers on which the article appears. Below are examples of journal citations from the example report shown in prior pre-lab sections:
Calvin, M. 1962. The path of carbon in photosynthesis. Science, 135:879–889.
Cordes, W.C. 1960. The responses of Elodea idioblats to environmental changes, temperature, and light. Physiologia Plantarum, 13:187–191.
Hill, R. 1939. Oxygen produced by isolated chloroplasts. Proceedings of the Royal Society of London, 127:192–210.
Masser, M.P. 2007. Impacts of Invasive Aquatic Plants. S. W. Hydrol. 6: 22–23.
Mazumder, A. and K.E. Havens. 1998. Nutrient-chlorophyll–Secchi relationships under contrasting grazer communities of temperate versus subtropical lakes. Can. J. Fish. Aquat. Sci. 55(7): 1652–1662.
McKee, D., K. Hatton, J.W. Eaton, D. Atkinson, A. Atherton, I. Harvey and B. Moss. 2002. Effects of simulated climate warming on macrophytes in freshwater microcosm communities. Aquat. Bot. 74:71–83.
Book
A citation for work that appears in a book uses a format which is similar to the journal citation format. The last name of the first author is followed by the initials of that author and then initials and last names of any additional authors. After the names comes the publication year. This is followed by the book title in italics, the edition number, publisher’s name and the place of publication. Following are the examples of book citations from the example report shown in prior pre-lab sections:
Falkowski, P.G. and J.A. Raven. 1997. Aquatic Photosynthesis. Blackwell Science, Malden, Massachusetts.
Garrett, R.H. and C.M. Grisham. 2010. Biochemistry. 4th edition, Brooks/Cole, Boston, Massachusetts.
Kirk, J. T. 1994. Light and Photosynthesis in Aquatic Ecosystems. 2nd Ed. Cambridge University Press, New York, New York.
Raven, P.H., R.F. Evert, and S.E. Eichhorn. 1992. Biology of Plants. 5th Ed., Worth Publishers, New York, New York.
Webpage
A citation of a website should include the following information: Name of the author (when available), date of publication or last revision, document title and the URL all enclosed in angle brackets (< >), and the date and time the site was accessed.
Masser, M.P. 2009, <Water Lettuce, http://aquaplant.tamu.edu/database/floating_plants/ water_lettuce.htm> May 8, 2009 4:10 pm CDT.
Masser, M.P. 2009, <Water Hyacinth, http://aquaplant.tamu.edu/database/floating_plants/ water_hyacinth.htm> May 8, 2009 4:15 pm CDT.
Helpful recommendations to consider in writing a scientific paper:
- The paper should be presented in a simple and well-organized format with the understanding that the reader may not be as knowledgeable about your experiment.
- Simple declarative sentences are a must. In addition, good sentence structure, spelling, grammar, and punctuation are required.
- Scientific names for organisms should be used when possible. The convention is to capitalize the genus and use italic font for both the genus and the species.
- Have someone proofread the paper. Have the reviewer make comments to clarify the information presented.
Lab Report Reviewer Checklist
The following checklist can provide an author or a reviewer with a basic listing of the elements that are included in a scientific paper. While this list is not exhaustive, it does address the major points a paper should address.
Title
☐ Does it clearly and exactly describe the research project?
☐ Is the common and scientific name of the organism included in the title?
Abstract
☐ Does it describe the research question and basic methods used in the experiment?
☐ Does it clearly summarize the results and conclusions?
Introduction
☐ Does it contain background information and give a general perspective?
☐ Is background information properly referenced?
☐ Does it include the hypothesis(es) to be tested?
☐ Does it provide a rationale for the procedures used?
☐ Is the significance of the investigation mentioned?
Materials and Methods
☐ Are the major procedures mentioned?
☐ Are any special materials mentioned?
☐ Could the experiment(s) be recreated from these procedures?
☐ Is the writing in paragraph form?
Results
☐ Are tables and/or figures used to clearly present the data?
☐ Are all important results verbalized?
☐ Are all tables and figures referred to in the description of the results?
☐ Are all tables and figures properly numbered and labeled, tables above and figures below?
Discussion
☐ How well are the reported results interpreted?
☐ How well are the results related to the original hypothesis(es)?
☐ In light of the reported results, are the conclusions valid?
Literature Cited
☐ Was the proper citation format followed?
☐ Are all works cited in the text listed in this section?
☐ Are all works listed in this section cited in the text?
General Format
☐ Is the paper clear and concise?
☐ Has the proper format been used?
☐ Is the spelling and grammar of good quality?
☐ Is the correct tense used for each section?