Chapter 2. Writing Lab
Results
The results section should present the data from the experiments in several ways. Tables of the raw data collected are not shown. Instead, a table of transformed data with the means and relevant statistical parameters is presented. Graphs and other figures that represent the data and any trends are also included in this section. In addition, a verbal description of the data presented is required. This description should point out all of the tables, graphs and figures and describe all of the important trends or developments in the data. Any difference between treatments, which show statistical significance, should be pointed out in the text. However, a common mistake is to include explanations of what the data means. Those efforts will be taken up as part of the discussion section. Another good general guideline is that the results section encompasses what was measured (e.g., production of oxygen) whereas the discussion section refers to the biological process of interest, (e.g., photosynthesis). The results section is written in past tense and in paragraph form.
What follows is an example of the results section:
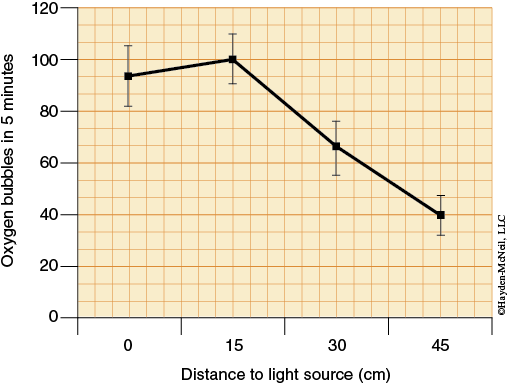
Oxygen production was determined by quantifying the number of oxygen bubbles. The number of oxygen bubbles counted decreased as the distance between the light and the cylinders decreased, except for the shortest distance (Figure 1). Although the number of oxygen bubbles produced was slightly higher at 15 cm than at 0 cm, this difference was not statistically different. However, the decrease in number of oxygen bubbles produced at 30 cm was statistically different from the shorter distances (0, 15 cm). In addition, the number of oxygen bubbles produced at 45 cm was statistically different from the values at the other distances.

Water clarity was measured in two lakes in the University Lake system, University Lake and Campus Lake. Clarity was significantly less in University Lake than Campus Lake, except in the spring of 2008 when there was no statistical difference between the two lakes (Table 1). University Lake’s clarity was lower in the fall than in both spring measurement periods. Water clarity was greater during the fall of 2008 than in the spring of 2009. Seasonally, there were no statistically significant changes in water clarity for Campus Lake.
Table 1. Water Clarity in University and Campus Lakes in Spring and Fall.
Label formatting for the figures and tables must follow a standard configuration. The titles for tables are placed above the table. Figures (including graphs) have the title below the figure. While the figures and tables are referred to in the text of the materials and methods section each element should be clear enough so that it can be comprehended without referring to the text. If material could be presented in either a table or a graph you should not use both to present the same data. Graphs are inherently better for showing patterns or trends in the results. On the other hand, tables allow specific and precise values to be reported.