Chapter 2. Analyzing Enzymes and Enzyme Kinetics I
Exercise 1. The Enzymatic Oxidation of Catechol—Reaction Rate
General Purpose
Conceptual
- Understand the general model of enzyme catalysis.
- Understand the relationship between light absorption and the concentration of a substance.
- Understand how to use a standard curve for the determination of an unknown.
- Understand the way data should be presented in table form.
- Understand the structure of a graph.
- Understand how to make a graph that represents data.
Procedural
- Gain proficiency in the use of pipettes and pipetting.
- Gain proficiency in the use of a spectrophotometer.
Materials per Student
Disposable gloves
Safety glasses
Materials per Student Group (2 students)
Spectrophotometer
Test tube rack
2 small culture tubes
Small Parafilm squares
One 1 mL pipette and blue pi-pump
Deionized water (dH2O)
Potato extract
0.05 M Catechol
Sharpie
One 10 mL pipette and green pi-pump
Procedure
- Turn the spectrophotometer on and allow it to warm up for 15 minutes.
- Make a data table in your laboratory notebook using the sample shown in Table 2-1 as a template.
Table 2-1. Rate of the reaction.
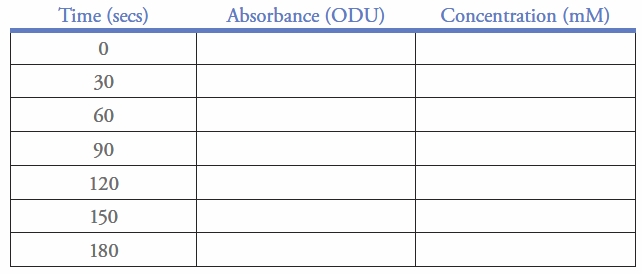
- Obtain two small culture tubes. Use a Sharpie to label the top of the tubes “1” and “2.” Tube 1 will contain the “blank solution”; tube 2 will contain the “reaction solution.”
- To prepare the “blank solution,” use the 10 mL pipette to add 8 mL of deionized water (dH2O) to tube 1. Use the 1 mL pipette to add 1 mL of the potato extract containing catecholase to the water. Cover the mouth of the tube with a small piece of Parafilm and invert the tube to mix well.
- Adjust the wavelength of the spectrophotometer to 500 nm. Set the mode to transmittance.
- To tube 2, the “reaction tube,” add 3 mL of dH2O and 5 mL of 0.05 M catechol.
- Add 1 mL of potato extract containing catecholase to the “reaction tube.” Quickly cover the top of the tube with Parafilm and invert the tube to mix the contents.
- Set the mode of the spectrophotometer to absorbance. Note the color of the reaction tube and record that observation in your laboratory notebook. Place the “reaction tube” in the spectrophotometer sample holder and record the absorbance in your laboratory notebook. This will be the absorbance reading for time “0.”
- Measure the absorbance every 30 seconds for 180 seconds.
- Remove the reaction tube from the spectrophotometer and note the color of the solution. How does the color compare to that of the solution at “0” seconds? Write the answer to this question in your laboratory notebook.
CLEAN-UP PROCEDURE
- Contents of tube 1 and tube 2 and the tube with potato extract can be poured down the sink drain.
- Markings on tube 1 and tube 2 should be removed before the tubes are placed in the plastic box on the laboratory instructor’s cart.
- Dispose of gloves in the biohazard waste container in the classroom.
- Return safety glasses to their designated place.
Determination of the Reaction Rate
Reaction rates are often expressed as changes in the concentration of product over time (e.g., millimoles of product/minute). The observations you have made during this exercise measure light absorption by the reaction solution. This light absorption is based on the concentration of chemicals in the solution (e.g., millimoles of substance/liter). To convert the absorption readings (ODU) to values related to the concentration of product you will use a standard curve (located on your lab bench) that shows the relationship between absorption and benzoquinone concentration.
Determine the concentration of benzoquinone for each of your observations and enter that information in the table you created in your lab notebook. Using the concentration data, on a new page in your laboratory notebook, create a graph of product (benzoquinone) concentration versus time. Include a figure caption and if needed a legend. Determine if the points (or some of the points) you plotted represent a straight line and if they do then add a best-fit trendline to your graph. The slope of this trendline (increase in product concentration/unit time) is directly related to the reaction rate (increase in product/unit time) for your reaction. Your graph will be evaluated using the rubric provided by your laboratory instructor. Make sure that you have evaluated your graph before submitting it to your instructor.
Preparation for Specific Enzyme Analysis
For the second enzymes lab, your lab group will design an experiment to investigate the impact of one of the following treatments on the basic enzymatic reaction you just studied (i.e., oxidation of catechol catalyzed by catechol oxidase).
The possible treatments are:
- Enzyme concentration
- pH
- Substrate concentration
- Temperature
- Structure of the substrate
- Source of enzyme
Your lab instructor will describe the general aspects of these various treatments and then your group will decide which of the factors above you want to investigate. If your group selects source of enzyme then you will need to obtain the material before the next lab meeting. You will tell your lab instructor which treatment your group has chosen and record your choice in your lab notebook.
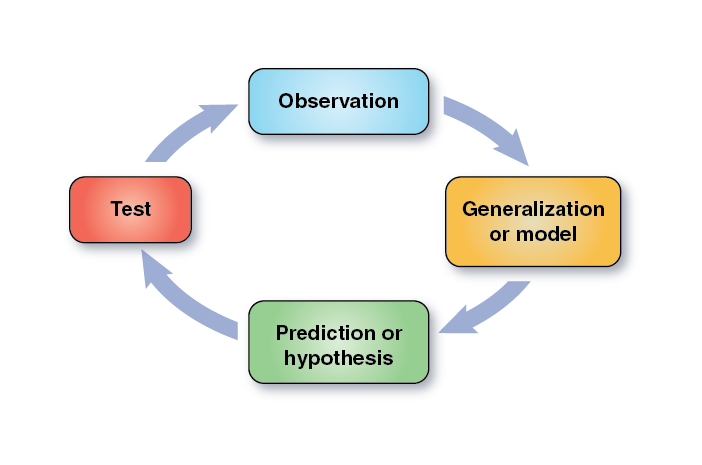
Once your group has chosen the treatment for the next lab the next step is to make a prediction about how changing that factor might affect the rate of the reaction. Your prediction should be based on your understanding of how enzymes catalyze chemical reactions. If you have trouble with this, ask your laboratory instructor for help. The predictions are part of the scientific method (Figure 2-12).
Your prediction can now be stated as a set of formal hypotheses. Hypothesis formation is one of the most important and often the most difficult steps of the scientific method. One important consideration in the formulation of testable hypotheses is to be sure that the data will allow one of the hypotheses to be rejected, thereby allowing the other hypothesis to be supported. In order to ensure that this happens, researchers often state their hypotheses in the form of a null hypothesis (H0) and an alternative hypothesis (Ha). The null hypothesis states that your treatment will have no effect on the process being studied. In other words there will be no meaningful difference in the results between the control group and the experimental or between various treatment groups. The alternative hypothesis is the alternative to the null hypothesis and states that there will be some effect based on the treatment involved. This means there should be some meaningful difference in the results between the control group and the experimental or between various treatment groups. The overall objective is to set up hypotheses which will result in one or the other being rejected (falsified) at the end of the experiment. Science only proceeds when a hypothesis is rejected. Remember in science you can only disprove something, never prove it.
As a group, formulate a null hypothesis and an alternative hypothesis for the next experiment based on the treatment your group has chosen. Before leaving lab make sure your lab instructor knows what your hypotheses are for the next experiment.
Post-Lab Quiz
Proceed to the Post-Lab Quiz