Chapter 2. Carbon Metabolism: Light and Photosynthetic Pigments
General Purpose
This lab will present some of the general concepts related to the process of photosynthesis, including some of the characteristics of light. The technique of paper chromatography will be used as part of the study of the general concepts related to light absorption, transmittance, and fluorescence.
Learning Objectives
General Purpose
- Develop a basic understanding of the reactions and role of photosynthesis.
Conceptual
- Have a general understanding of how a mixture of photosynthetic pigments can be separated from each other by the technique of paper chromatography.
- Know what characteristics of the pigment molecules are important in determining their rates of movement in the technique of paper chromatography.
- Gain an understanding of the relationship between absorbance and transmittance of light and photosynthetic pigments.
- Know what fluorescence is and how it is associated with the absorption of light by chlorophyll.
Procedural
- Gain a proficiency in a chromatographic technique.
- Determine the wavelengths which may be most useful for the process of photosynthesis by determining the absorption spectra of the various pigments separated by paper chromatography.
This laboratory consists of four exercises. You should begin with Exercise 1. Exercises 2 and 3 are demonstrations and Exercise 4 is dependent on you completing Exercise 1.
Exercise 1. Separation and Identification of Chloroplast Pigments by Paper Chromatography
Materials
Chromatography paper: 1 sheet/group (11 cm × 15 cm)
Pigment extract in dark bottle
Chromatography chamber (quart jar)
Chromatography solvent (9 petroleum ether:1 acetone)
Capillary tube
Pencil
Ruler
Forceps
Stapler
Paper towel
Procedure
Work in groups of two and prepare a chromatogram using pigments extracted from either spinach leaves or the cyanobacterium Spirulina.
1. Put on gloves and obtain a sheet of chromatography paper. Place it on a clean paper towel.
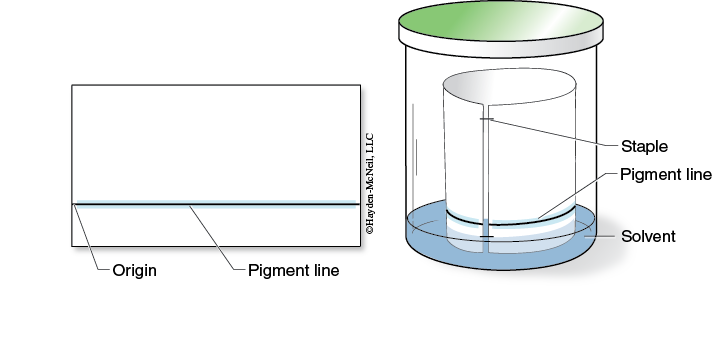
2. Use a ruler and pencil to draw a faint origin line on the long edge of the paper about 2 cm from the bottom (Figure 7-7).
3. Obtain a small vial of pigments extracted from either the cyanobacterium Spirulina or spinach leaves.
4. Dip a capillary tube in the pigment extract and quickly apply a thin line on the origin line, as shown in Figure 7-7.
5. Let the origin/extract line dry for 30 seconds. Repeat steps 4 and 5 ten times, keeping the pigment line as narrow as possible.
6. Discard the capillary tube in the sharps container and return the vial of pigment extract to the front table.
7. Obtain a chromatography chamber (mason jar) and if needed, add chromatography solvent to a depth of ~1 cm or less.
8. With minimal handling, form a cylinder with the chromatography paper. Staple the top & bottom so that the edges do not touch or overlap, as seen in Figure 7-7.
9. Gently place the chromatography paper cylinder into the chromatography chamber so that the origin line is above the solvent.
10. Return the lid to the chamber & allow the pigments to separate until the solvent is within 1 cm from the top of the paper (~30 minutes).
11. After the pigments separate, use forceps to remove the cylinder from the chromatography chamber and return the lid.
12. Allow the chromatogram to dry, and then remove the staples.
|
|
||||||||||||
Results
Observe the different pigment bands on the chromatogram. Record your results as a sketch in your laboratory notebook. You might also want to take a picture of the chromatogram if you have a phone with a camera. Record the color of each pigment line and the relative position of the colors along the paper. Gray bands present between the carotene and xanthophylls are phaeophytins, a breakdown product of chlorophyll a and b (chlorophyll a and b without Mg+2).
Interpreting the Results
After you have sketched the chromatogram in your laboratory notebook and identified the various pigments, answer the following questions in your laboratory notebook.
- How does the chromatogram compare with the predictions you made for the pre-lab?
- Which pigment is the most soluble in the chromatography solvent? How do you know?
- Which pigment is the least soluble? How do you know?
- Which pigment appears to be the most nonpolar?
- Which pigment appears to be the most polar?
- What general structural feature of chlorophylls a and b cause them to remain closer to the origin?
CLEAN-UP PROCEDURE
- All organic solutions should be discarded in the container labeled “Pet. Ether and Acetone Waste” near the sink. The solutions should not be poured down the drain. Also, remember to screw the cap back on the container!
- All capillary tubes used in Exercise 1 should be discarded in the “SHARPS” container on your lab bench.
- Dispose of gloves in the biohazard waste container at the front of the classroom.
Exercise 2. Absorption and Transmission of Light
This laboratory exercise is designed to help you better understand some of the principles of the energy-capturing reactions of photosynthesis as demonstrated by the differential absorption and transmission of light by different colored solutions.
Materials
Spectroscope
Colored filters (red, blue, and green)
Pigment extract (from spinach leaves)
Acetone (solvent for the pigment extraction)
PROCEDURE
A spectroscope (Figure 7-8) is a device that contains a prism and displays the total visible spectrum when a white light source is passed through the light slit. If a colored, transparent filter is placed between the light source and the spectroscope, some of the visible rays will be eliminated from the spectrum (as a result of being absorbed by the filter). Therefore, the spectroscope can display the light waves transmitted by the filter.
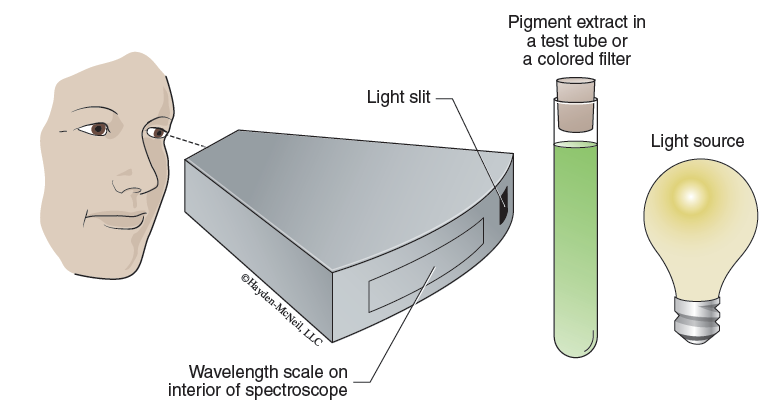
- With the lamp on and positioned such that light is shining through the slit in the back of the spectroscope, observe the visible spectrum through the eyepiece. A nanometer scale will be in view beneath the spectrum. This makes it easy for you to see the different colors of the spectrum and their respective wavelengths in nanometers.
- One by one, place each of the colored filters or solutions (pigment extract and acetone) in front of the light slit of the spectroscope. Observe the spectrum produced by each sample. Make a copy of Table 7-1 in your laboratory notebook and record your results in that table.
Results
Table 7-1. Absorption and transmission of light.
Interpreting the Results
Write out the answers to each of the following questions in your laboratory notebook.
- What is the general relationship between the color of a filter/solution and the light that it absorbs?
- Is there a difference in the wavelength of light absorbed by the green filter and by the pigment extract?
- What is the function of the acetone in this exercise?
Exercise 3. Fluorescence of Spinach Pigment Extract
In their natural setting when chlorophyll molecules have electrons energized by light, the energized electrons are quickly accepted by nearby protein molecules and used in the light reactions. In the case of isolated pigments there aren’t any of these closely associated neighboring protein molecules to accept the energized electrons. One way for those electrons to lose the energy so they return to the normal state is to release the energy as fluorescence.
Materials
Flask of spinach pigment extract
Source of white light (flashlight)
PROCEDURE
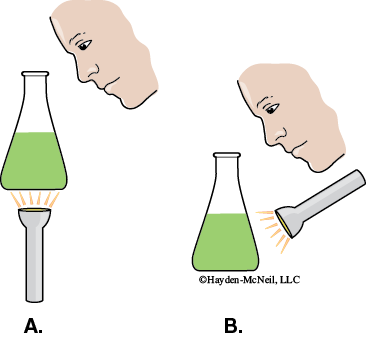
In a darkened room, use a flashlight to view the spinach pigment extract.
- View the extract from above while holding the flask so that the light shines through it from below (Figure 7-9A).
Record the answer to the following question in your laboratory notebook.
What color do you see?
Why?
- View the extract from above while holding the flask such that the light shines on it from above (Figure 7-9B)..
Record the answer to the following question in your laboratory notebook.
What color do you see?
Why?
Exercise 4. Determining the Absorption Spectrum for Spinach Leaf Pigments and Spirulina Pigments
Using a spectrometer you can determine the absorbance for each pigment that you separated in Exercise 1 at different wavelengths of light. The instructions for using the spectrometer are on the instrument and in Appendix A of this manual. Ask your instructor for assistance if necessary.
Materials per Group
5 cuvettes
Parafilm
Acetone
Scissors
Spectrometer
4 – 50-mL beakers to elute pigments
Kimwipes
PROCEDURE
1. Work in groups of four for this exercise.
2. During this experiment you will be collecting absorbance data at varying wavelengths for the pigments that were separated during the chromatography procedure. To record the data construct a table in your lab notebook similar to the example shown in table 7-2.
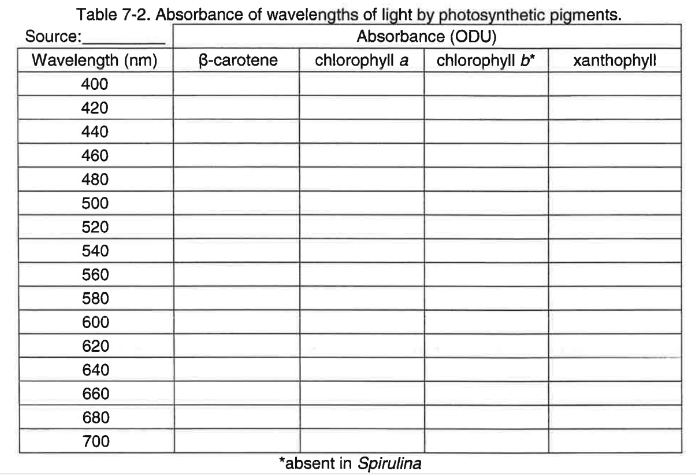
3. Use scissors to cut out strips of the separated pigments listed in Table 7-2 from the chromatogram.
4. Combine like pigment strips from the chromatograms produced by each group and cut the strips into ~ 1 cm lengths (estimate) into the small labelled beakers.
5. Turn on the spectrometer by holding the power button on the right side for about three seconds or until the LED lights start to flash (see Figure 7-10).

6. Plug the spectrometer into the computer via the USB cable (see Figure 7-10). To wirelessly connect to the spectrometer with a personal laptop or tablet, add a device in the Bluetooth settings and select the spectrometer that matches with the ID # on the bottom of the instrument.
7. Open the PASCO Spectrometry app by click the icon ![]() . This should now show the initial screen of the PASCO Spectrometry display (see Figure 7-11) on your computer or tablet.
. This should now show the initial screen of the PASCO Spectrometry display (see Figure 7-11) on your computer or tablet.
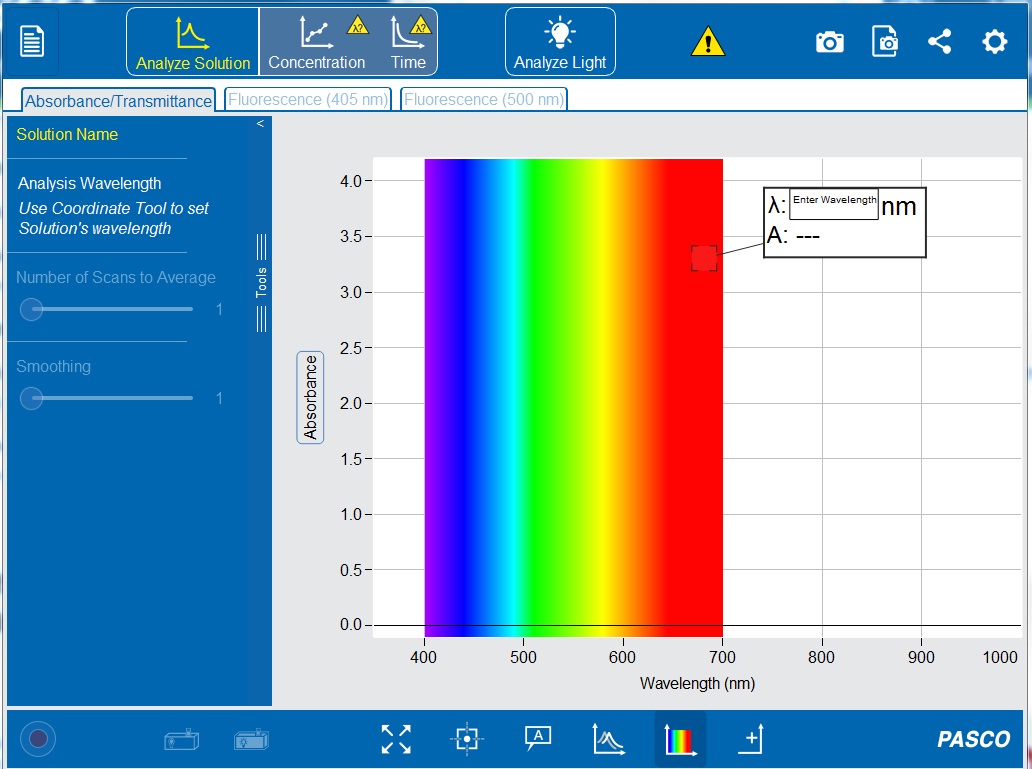
8. After a few seconds, the ‘Connection Status’ symbols on the top toolbar should turn from ![]() to
to ![]() . Click the circle to check that the ID # on the bottom of the spectrometer matches the display on your computer or tablet. If connecting wirelessly, a ‘Sensor Not Found’ error should pop up. Click
. Click the circle to check that the ID # on the bottom of the spectrometer matches the display on your computer or tablet. If connecting wirelessly, a ‘Sensor Not Found’ error should pop up. Click ![]() . Select the spectrometer with the corresponding ID # and click
. Select the spectrometer with the corresponding ID # and click ![]() . If a connection error does not pop up, click
. If a connection error does not pop up, click ![]() on the top toolbar.
on the top toolbar.
9. Make sure the “Absorbance/Transmittance” tab ![]() is open on the top toolbar and the “Analyze Solution”
is open on the top toolbar and the “Analyze Solution” ![]() setting is selected.
setting is selected.
10. Extract the pigments from the paper by adding ~10 mL of acetone to each beaker and gently swirling. Remember to close the acetone bottle.
11. Pour the pigment suspensions from each beaker into separate cuvettes, filling them half-way.
12. Prepare a blank by filling a cuvette half-way with acetone using the acetone squeeze bottle.
13. Wipe the blank cuvette with a Kimwipe and gently insert it into the cuvette holder. The cuvette should fit snugly.
14. On the bottom toolbar, click “Calibrate Dark” ![]() to calibrate the spectrometer with the light turned off. A progress bar should appear, and after the calibration is complete, a check mark
to calibrate the spectrometer with the light turned off. A progress bar should appear, and after the calibration is complete, a check mark ![]() should appear.
should appear.
15. Wait one to two minutes to allow the light source to warm up, then click “Calibrate Reference” ![]() to calibrate the spectrometer to the blank solution with the light on.
to calibrate the spectrometer to the blank solution with the light on.
16. On the bottom toolbar, click “Start Record” ![]() . The symbol will change to the “Stop Record”
. The symbol will change to the “Stop Record” ![]() icon and a horizontal line should appear at 0.0 ODU, indicating the spectrometer was properly calibrated. Tiny peaks in the line show noise, but if there are major peaks, repeat steps 14 and 15 to recalibrate the spectrometer.
icon and a horizontal line should appear at 0.0 ODU, indicating the spectrometer was properly calibrated. Tiny peaks in the line show noise, but if there are major peaks, repeat steps 14 and 15 to recalibrate the spectrometer.
Since absorbance is being measured over a range of wavelengths, there is no need to set a wavelength.
17. Remove the blank cuvette from the spectrometer and return it to the rack.
18. Wipe the first pigment suspension cuvette with a Kimwipe and insert it into the cuvette holder. The absorbance spectrum for the extract will appear. Make sure the “Analyze Solution” ![]() option is selected.
option is selected.
Note: if the data plateaus at any point in the scan remove the sample and dilute with acetone
19. Click ‘Record’ to stop collecting data.
20. Just above the graph, rename the solution to the appropriate pigment.
21. To obtain the absorbance values for the desired wavelengths in Table 7-2, either enter the wavelengths in the white box or manually move the ‘Coordinate Tool’ along the spectrum. Do not click the checkmark to set a wavelength. Record the absorbance for each wavelength in the table you created in your lab notebook.
22. To take a picture of the absorbance spectra, click ‘Take Journal Snapshot’ the top toolbar. When the image appears, click the download symbol (‘Save Snapshot to File’) in the bottom left corner to save a .PNG file.
23. Repeat steps 18-22 for the remaining pigment suspensions.
24. Overlay all the pigment spectra by using the ‘Show Comparison Mode’ on the bottom toolbar.
Results
In your laboratory notebook record which pigment extract was used for the absorbance measurements.

CLEAN-UP PROCEDURE
1. Turn off the spectrometer.
2. Discard all organic solutions in the labelled waste container and return the lid. Do not pour solutions down the drain.
3. Discard the small pieces of chromatography paper in a separate labelled waste container and return the lid.
4. Rinse the cuvettes with acetone. Discard the acetone in the labelled waste container and return the cuvettes to the rack upside down to dry (four cuvettes for Spirulina or five for spinach).
5. Make sure all the solvent containers are closed.
6. Discard only gloves in the biohazard bag.
7. Return the protocol sheets to the front table.
8. Push in your chair. See your instructor regarding any In-Class Assignment.
Post-Lab Quiz
Proceed to the Post-Lab Quiz