Chapter 2. Carbon Metabolism: Rate of Photosynthesis and Cellular Respiration
General Purpose
This pre-lab will present some of the general concepts related to the measurement of the net rate of cellular respiration using different carbon sources of organic molecules by measuring carbon dioxide production.
Learning Objectives
General Purpose
Conceptual
- Understand the meaning of net cellular respiration.
Background Information
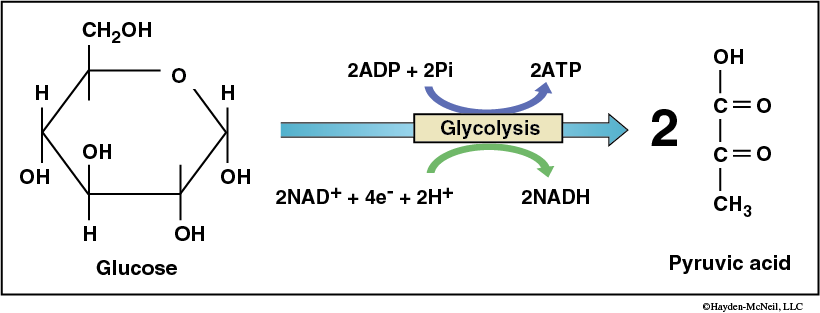
The process of cellular respiration provides a mechanism by cells can metabolize organic nutrients and produce ATP in the presence of oxygen. Glycolysis converts glucose to two pyruvates and generates two ATP molecules and two molecules of the reduced form of nicotinamide adenine dinucleotide (NADH) (Figure 8-4). In subsequent steps the pyruvate molecules (pyruvic acid).
In subsequent steps via the citric acid cycle which require aerobic conditions (the presence of oxygen) the pyruvic acid (pyruvate) from the end of glycolysis is oxidized further to produce more ATP and NADH along with FADH2 (Figure 8-5).
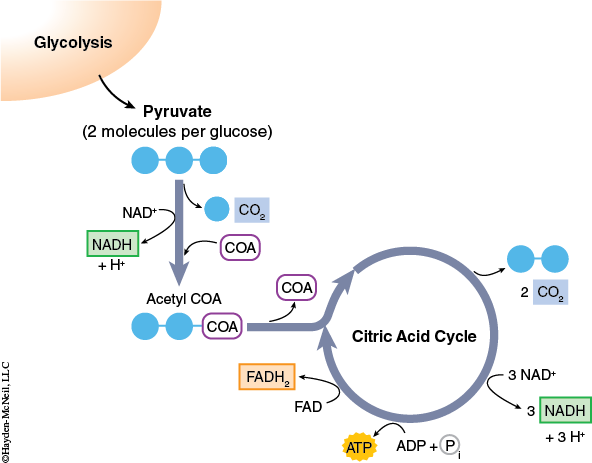
During this oxidation of pyruvate and the citric acid cycle the carbons that were part of the organic molecules that enter the pathway are released as CO2. It is possible that some of the produced CO2 could by use by the organism, be lost to the environment, or complex with other compounds so that it cannot be measured. This means the rate of CO2 production, based on CO2 release, is a net rate.
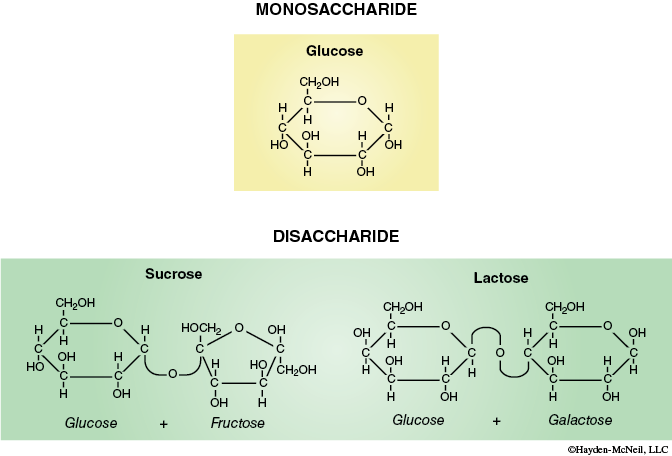
Yeast, Saccharomyces cerevisiae, strains are versatile laboratory organisms. They grow rapidly and have simple nutritional requirements. Aerobically they convert glucose to CO2 and H2O. Glucose isn’t the only carbon source that can feed into glycolysis. Other carbohydrates (and even some amino acids) can enter the pathway at various points.
The effect of varying the starting carbon source molecule on the rate of net CO2 production by yeast will be investigated. Figure 8-6 shows the chemical structures associated with the various substances you will use to measure the rate of net carbon dioxide production.
Pre-Lab Quiz
Proceed to the Pre-Lab Quiz