Chapter 2. Carbon Metabolism: Fermentation
General Purpose
This lab focuses on measuring the rate of fermentation by yeast, Saccharomyces cerevisiae, indirectly by measuring the amount of carbon dioxide produced in alcohol fermentation using fermentation tubes.
Learning Objectives
General Purpose
Conceptual
- Describe the process of alcoholic fermentation, naming the substrate and products.
- Explain how fermentation in yeasts can be measured.
- List factors that can affect the rate of yeast fermentation.
Procedural
- Measure the carbon dioxide production in fermenting yeast cultures of various sugar and sugar-substitute solutions.
- Analyze and interpret your data.
Exercise 1. Indirect Measurement of CO2 Production Using Fermentation Tubes
Materials
Culture tube rack
6 culture tubes
6 fermentation tubes
6 Pasteur pipettes
1 pipette bulb
Marking pen
Stock solution of yeast
Lactaid
Deionized water
0.5 M glucose stock solution
0.5 M lactose stock solution
1% starch solution
0.5 M sucrose stock solution
PROCEDURE
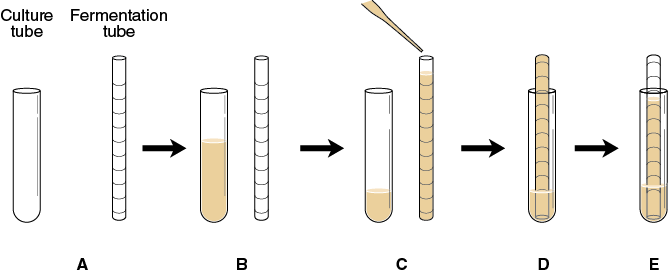
- Each carbohydrate solution to be tested for fermentation will need a culture tube and a fermentation tube for each sample (Figure 9-6A).

Label the culture tubes appropriately based on the solutions designated for your group (see Table 9-4).
Table 9-4. Test solutions.
- Into each culture tube, add 5 mL of the yeast solution and 5 mL of one of the test solutions (see Table 9-4). Each culture tube should have a total volume of 10 mL (Figure 9-6B).
- Use a clean Pasteur pipette with a pipette bulb to fill each fermentation tube to the top with a different yeast–carbohydrate solution (Figure 9-6C). Standing the fermentation tubes in their respective culture tubes will help you keep them in order. Do not invert the fermentation tubes at this time.
- One by one invert each fermentation tube and place it upside down into the liquid remaining in its respective culture tube being careful not to introduce air bubbles (Figure 9-6D). If any air bubbles are in the fermentation tube, mark the air level in the tube.
- Place the culture tube with fermentation tube in a water bath at 40°C. Incubate for 60 minutes. Observe and record any increase in the gas level in each fermentation tube every 5 minutes (Figure 9-6E) in the table you prepared in your laboratory notebook that looks like Table 9-5.
Table 9-5. CO2 production in yeast.
Interpreting the Results
Record the class data in an Excel spreadsheet for the volume of CO2 produced for each of the solutions. Calculate the mean and the standard deviation of the CO2 production for each substrate. Create a graph of the means of each of the solutions vs. time. Add error bars and best-fit line to the graph. Make sure to label each axis and write a figure caption.
In your laboratory notebook, answer the following questions:
- Compare the slope of the lines. Are there differences?
- Which hypothesis would be rejected on the basis of the results?
- Was the data for your group very different from the pooled group data?
If yes, how was it different?
- What could account for differences in the data between groups?
- What is the function of the fermentation tube containing distilled water?
- Explain how volume changes could occur in this tube.
- Which carbohydrate yielded the largest amount of carbon dioxide production by the yeast?
- Why did the other solutions not produce as much carbon dioxide?
CLEAN-UP PROCEDURE
- Rinse the fermentation tubes with distilled water several times and use a pipe cleaner as a test tube brush to clean the inside of each of the fermentation tubes. Invert the fermentation tubes in the container labeled “fermentation tubes.” Discard the pipe cleaner.
- Rinse the culture tubes and place them in the discard box (not the trash).
- Make certain that all Pasteur pipettes have been discarded in the Broken Glass box.
- Make certain that all materials have been returned to their designated area.
Post-Lab Quiz
Proceed to the Post-Lab Quiz