Chapter 2. ECOSYSTEM ECOLOGY— AQUATIC I—SAMPLING
Learning Objectives
General Purpose
Conceptual
- Be able to determine the change in an ecosystem caused by either biotic or abiotic factors.
- Determine the relationship between autotrophic and heterotrophic factors and energy flow in an ecosystem.
Procedural
- Be able to properly sample aquatic ecosystems.
- Be able to extract and measure chlorophyll levels in aquatic ecosystems.
General Purpose
An ecosystem is made up of all the populations of organisms (the community) as well as all of the non-living factors in a defined area. The area may be predefined (the Pacific Ocean, the University Lake system) or the area may be defined by the researcher (one square mile in the Kisatchie National Forest). The organisms in an ecosystem interact with their environment. In these interactions the organisms of the community in the ecosystem may be impacted by the environmental factors. In addition, the organisms in an ecosystem can cause changes in the environmental factors. The environmental factors include biotic factors (the populations present) and abiotic factors (water, light, nutrients, temperature, soil type, topography, etc.).
One of the main aspects in studying an ecosystem is understanding the energy flow in the ecosystem. Th e energy fl ow in an ecosystem includes the basic food web structure of the ecosystem (see Figure 5-3).
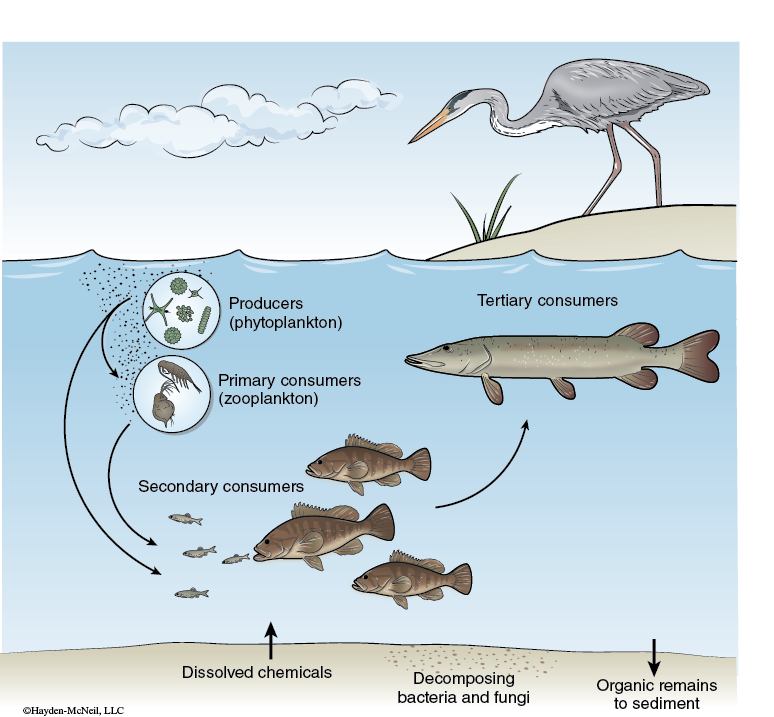
Autotrophs are the primary producers in the ecosystem. Photoautotrophs harvest light energy and convert it into chemical energy through photosynthesis. The amount of energy they convert is the gross primary production (GPP) for the ecosystem. All biochemical energy in ecosystems is initially introduced into the system through autotrophs. Heterotrophs and autotrophs can both use this chemical energy through cellular respiration (R), which converts chemical energy in one form to chemical energy in a more directly usable form for the cells of the organism. The net primary production (NPP) is the energy produced by autotrophs in excess over that used by heterotrophs and autotrophs. The NPP is an indicator of the production of the entire ecosystem.
One way to indirectly assay the amount of photosynthesis (and therefore the GPP) within an ecosystem is to measure the chlorophyll present. As the number of photoautotrophs goes up, the chlorophyll should also rise.
The focus of the lab is three of the lakes and a stream (part of the watershed) adjoining the LSU campus. The University Lake system is a five-lake system (see Figure 5-4) that comprises 300 acres. The system is part of a watershed that takes in water from the surrounding area and also discharges water into Bayou Duplantier.
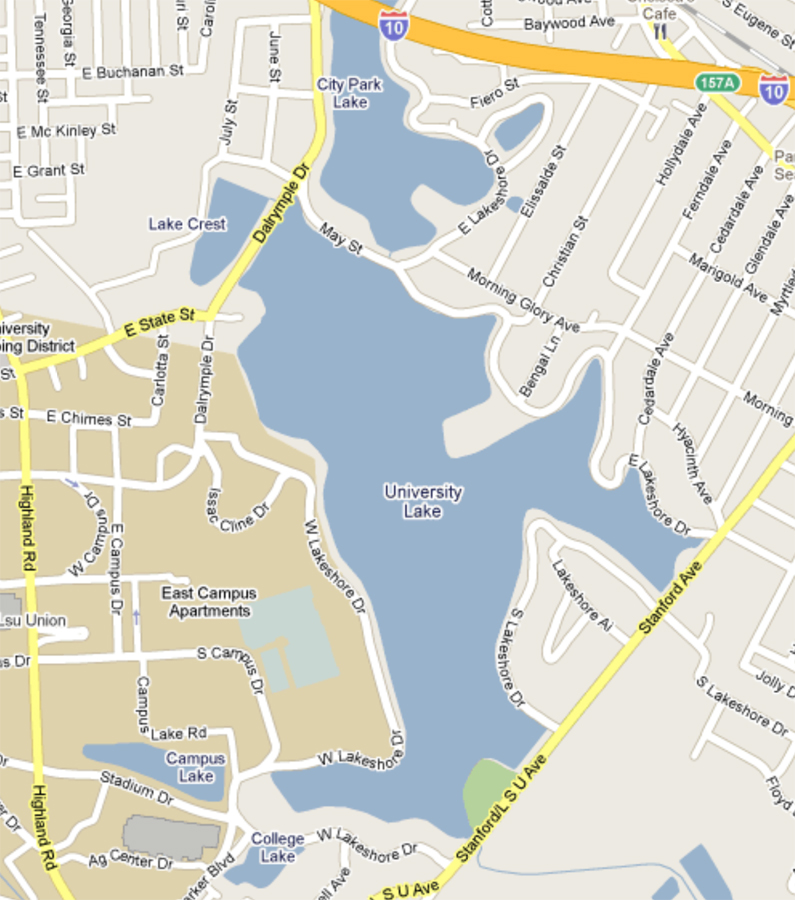
The health of this water system can fluctuate based on a number of influences, and fish kills have occurred periodically in the past, especially during the warm summer months.
When assaying the health of an ecosystem, ecologists are often interested in the abiotic or biotic factors that may be limiting in an ecosystem. The limiting component can determine the carrying capacity of populations in the ecosystem. In turn, the health and size of the individual populations of the community in the ecosystem can impact the abiotic factors. The limiting factor(s) will differ between species and potentially over time. Thus, ecosystem ecologists are often concerned about how the abiotic factors (nutrients) vary over time.
Since assaying these factors once will provide only a snapshot view of the ecosystem, you will need to compare your measurements to past measurements. These comparisons will allow you to gauge if there are any changes occurring in the ecosystem and if there is a discernible pattern to those changes.
Some of the abiotic factors include depth, water clarity, temperature, pH, nitrogen cycle components (nitrate, nitrite, ammonia), phosphorus, and dissolved oxygen levels. Possible biotic factors include autotrophs (measured through chlorophyll levels) and heterotrophs (detected together with autotrophs by dissolved oxygen usage).
Abiotic Factors
Depth: Very shallow lakes such as the LSU lake system can have water quality issues based on the fluctuation of temperature and the overgrowth of vegetation.
Clarity: Water clarity affects how deep sunlight can penetrate. This directly affects how much of the water is available for the growth of light-dependent autotrophs. Heterotrophs may survive in water with low clarity by surviving on other heterotrophs and autotrophs that die and drift downward.
Temperature: All living organisms have limited temperature ranges for survival. The water temperature directly affects metabolic rates and the chemical solubility affecting nutrient availability, and therefore has an impact on the growth rates of many organisms (e.g., cooler water can hold more dissolved oxygen).
pH: Aquatic organisms are directly dependent upon the water’s pH due to their own pH sensitivities and indirectly as pH affects the solubility of many nutrients and toxins.
Nitrogen Cycle Components: The movement of nitrogen in various chemical forms through the environment.
Ammonia (NH4+): Nitrogen-fixing bacteria convert nitrogen gas to ammonia, which can then be converted to the form used by plants. Ammonia results from metabolic waste and bacterial decay of organic material. Nitrogen fertilizers introduce ammonia into the environment.
Nitrite (NO2): A short-lived form of nitrogen intermediate between ammonia and nitrate. Chemotrophic bacteria convert ammonia to nitrite, and then other species of bacteria convert nitrite to nitrate.
Nitrate (NO3): The form of nitrogen that is usable by plants, where it can be converted to nitrogen-containing amino acids for use by heterotrophs.
Phosphate: Phosphate is an essential nutrient for both heterotrophs and autotrophs. Phosphate is often the limiting nutrient in freshwater systems. Natural levels of phosphate are 0.05 mg/mL. Poor water quality in many lakes and aquatic ecosystems is partly due to accumulated phosphate in the bottom sediments. Excessive phosphate can result in excessive algae growth (algae blooms) which is one cause of the fish kills the University Lake system periodically experiences. Algae blooms can release toxins, block sunlight, thus reducing lake autotrophs, and reduce dissolved oxygen. Phosphate occurs naturally in rocks and soil. Sources of excess harmful phosphate are fertilizers, animal feed, animal waste, and sewage.
Dissolved Oxygen: The availability of dissolved oxygen in an ecosystem can determine whether many heterotrophs can survive. Low levels of dissolved oxygen result in the death of heterotrophs, including fish. Oxygen is produced by autotrophs and is used by autotrophs and heterotrophs. Decomposition of organisms can lead to oxygen depletion in aquatic systems.
Biotic Factors
Chlorophyll: Chlorophyll is found in the lake system autotrophs, including aquatic plants, cyanobacteria, and archaeans. Chlorophyll can be used as a relative measure of autotrophic concentration. Working in groups your lab will collect and analyze samples from four sites. Data collected by your lab will be shared not only with other sections, but also with future students, who will collect data at these same sites.
Procedure
- Record which field site your group will go to for sampling and record which field studies will be conducted in your laboratory notebook.
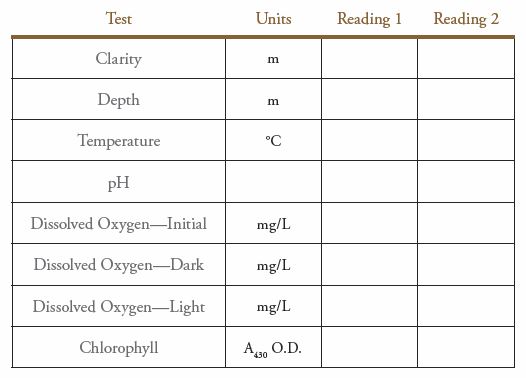
- Prepare a results table in your laboratory notebook for the analysis you will complete today, using the following template as a guide.
Table 5-1. Water quality data for test site _____________________on date _______________ .
Field Materials
Bucket containing:
Secchi disk (except for site 2)
Tape measure (except for site 2)
Thermometer
Water collector
Two field sample bottles
Methods sheet and site map
Field Procedures
A. Clarity
- Lower the Secchi disk into the water of the test site, counting the marks as they enter the water (blue ½ meter; black 1 meter).
- Note depth on rope when the Secchi disk can no longer be seen.
- If you cannot read rope level at water, mark line at edge of bridge railing with orange clips.
- Raise Secchi disk to surface of water.
- Mark the rope at same height as for previous level.
- Measure difference between marks on the rope with the tape measure.
- Record the depth on your data sheet.
- Repeat the process (steps 1–7) to get a second reading.
B. Depth
- Lower the Secchi disk to the bottom of the water of the test site.
- Note depth on Secchi disk rope.
- If you cannot read rope level at water, mark line at edge of bridge railing.
- Raise Secchi disk to surface of water.
- Mark rope level at same height as for bottom.
- Measure difference between marks on the rope at bottom and top of water.
- Record the depth on your data sheet.
- Repeat the process (steps 1–7) to get a second reading.
C. Temperature
- Lower water collector into the water and fill ¾ full.
- Raise water collector.
- Remove sleeve from thermometer.
- Turn on the thermometer and set to read Celsius (button on back).
- Immediately insert thermometer probe into the water to a depth of approximately 10 cm.
- Wait 1 minute.
- Record temperature on data sheet.
- Repeat the process (steps 1–7) to get a second reading.
- Turn off thermometer.
D. Sample Collection
- Fill two field sample bottles. Avoid sediment when filling bottles.
Laboratory Analysis Procedures on Collected Water Samples
If you did not bring your laboratory notebook with you to the field site, then record all of your field readings into the data table in your laboratory notebook.
A. pH
- Perform readings on both collected water bottles once your group returns to lab.
- Pour a sample from the first field sample bottle into a sample container.
- Slide probe from holder in pH meter.
- Insert pH probe approximately 5 cm into sample.
- Turn on pH meter.
- Gently move probe and take reading when pH meter says “ready” next to the number.
- Rinse probe with dH2O.
- Record pH in the data table in your laboratory notebook.
- Discard the sample and repeat the process (steps 2–8) using a sample from the second field sample bottle.
- Rinse probe with dH2O. Wipe with tissue and return to holder in pH meter.
- Turn off pH meter.
Chlorophyll Determination Procedure
If you did not view the chlorophyll extraction video from the abiotic and biotic assays pre-lab, you should do so before coming to lab.
Filtering Station (see detailed instructions at the station)
- Place glass microfiber filter in Büchner funnel using forceps.
- Rinse filter with approximately 25 mL dH2O using gentle vacuum pressure.
- Invert collected water sample to mix.
- Use graduated cylinder to measure 50 mL of sample from one of the field sample bottles.
- Filter measured sample through Büchner funnel.
- Pick up filter with the forceps and place in an extraction test tube. (Note: Do not smash the filter or wad it into a ball.)
- Depending on your section, your group may need to repeat this process (steps 1–6) using a sample from another field sample bottle. Ask your lab instructor.
Acetone Station
- Add 10 mL of acetone to test tube with the filter.
- Stopper the top of tube.
- Vortex tube 60 seconds.
- Place a Whatman #1 filter in a funnel and place funnel in a spectrophotometer test tube.
- Add the entire extracted sample to funnel and filter into the spectrophotometer test tube.
- Remove the Whatman #1 filter from funnel and discard in marked disposal container.
- Remove glass microfiber filter from original tube with forceps and discard in marked disposal container.
- Return extraction test tube to initial filtering station.
- Note if you are doing a second sample, repeat this process (steps 1–8) using the extracted sample from the second sample bottle.
Spectrophotometer
If necessary, review the spectrophotometer information in Appendix A.
- Blank spectrophotometer at 430 nm using an acetone blank.
- Read sample absorbance at 430 nm.
- Record reading in the data table in your laboratory notebook.
- Note if you are doing a second sample, repeat the process (steps 2–3) for the second sample.
Cleanup
- Make sure to empty vacuum flask into sink.
- Discard acetone waste from original tube and spectrophotometer tube in waste container and filters in marked disposal containers.
- Place spectrophotometer tubes in the dirty tube bin. Return extraction test tube to filtering station for next class period to use.
B. Dissolved Oxygen Analysis
(selected sections perform this test)
Wear gloves and safety goggles.
- Record the time light and dark bottles were in the lake and initial dissolved oxygen readings (from instructor).
- Remove the stopper from the dark sample.
- Add contents of one Dissolved Oxygen 1 Reagent Packet.
- Add contents of one Dissolved Oxygen 2 Reagent Packet.
- Tilt bottle and replace stopper carefully to avoid introducing air bubbles.
- Shake the bottle vigorously.
- Incubate 5 minutes.
- Record any observations in your notebook.
- Shake bottle.
- Incubate 5 minutes.
- Add contents of one Dissolved Oxygen 3 Reagent Packet.
- Shake the bottle vigorously.
- Incubate 5 minutes.
- Record observations in your notebook. Sample will be yellow if oxygen is present.
- Add 5.8 mL of treated sample to observation vial with a measuring tube. Place observation vial on white sheet of paper.
- Add sodium thiosulfate standard solution one drop (55 μL) at a time until solution is colorless. Count your drops and shake between drops.
- Record number of drops in your notebook.
- Calculate ppm/L dissolved oxygen.
- ppm/L dissolved oxygen = Total number of drops of sodium thiosulfate standard solution
- Rate: ppm/L/hr dissolved oxygen = ppm/L dissolved oxygen ÷ number of hours in lake
- Discard solutions in the designated (labeled) liquid waste bottle.
- Rinse bottles with dH2O, tube and vial twice with H2O.
- Repeat with other two samples.
- Calculate the NNP and the GPP and R.
Calculations for the NPP, GPP, and R
Result units are mg/L/hr dissolved oxygen:
NPP = Light − Initial
GPP = Light − Dark
R = Initial − Dark
Post-Lab Quiz
Proceed to the Post-Lab Quiz