Chapter 2. SYSTEMATICS
Learning Objectives
General Purpose
Conceptual
- Be able to differentiate between different classification systems.
- Be able to describe the role systematics plays in modern biology.
- Be able to use different methods to develop classifications and phylogenetic trees.
Procedural
- Gain experience deciding what counts as a trait and why traits are chosen as grouping criterion and for building trees.
- Gain proficiency in building and reading phylogenetic trees.
- Be prepared to build phylogenetic trees to aid in learning the phyla (one level of taxonomic organization) and their characteristics presented in the diversity section of the course.
Exercise 1. Classification
PROCEDURE
Using the collections of hominid skulls on the table create a dichotomous (branching into two) classification that organizes all of the hominid skulls. Create an organizational pattern like the one shown below (Figure 8-5). Fill in the character (e.g., number of eyes, shape of forehead, etc.) used at each branch point.

Exercise 2. Use the Methods of Evolutionary Taxonomy to Evaluate Characters
PROCEDURE
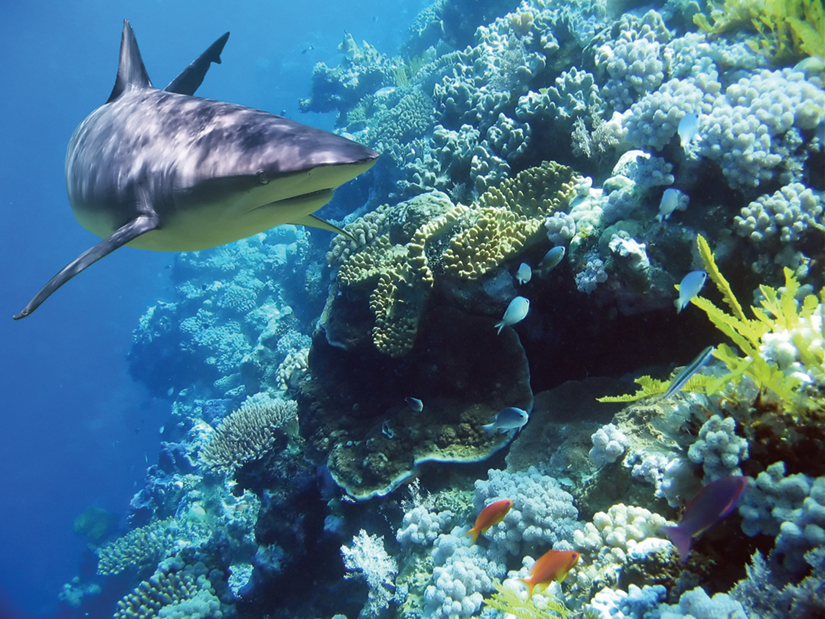
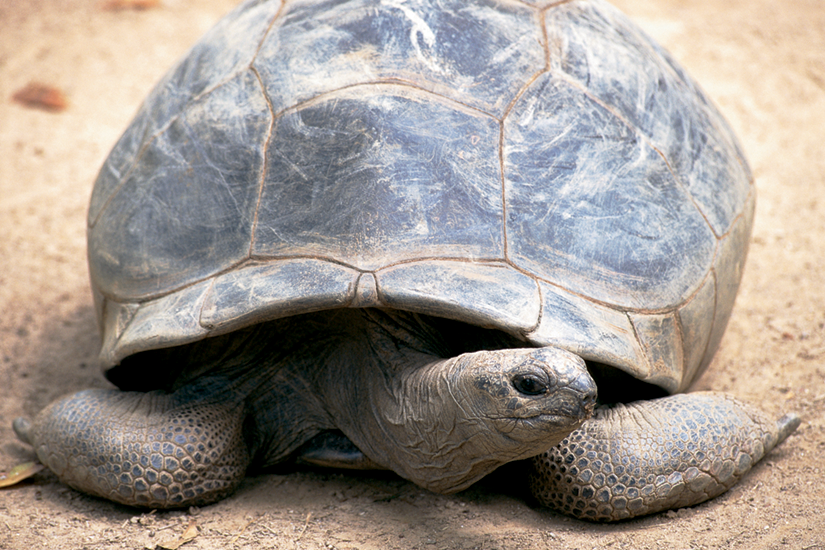
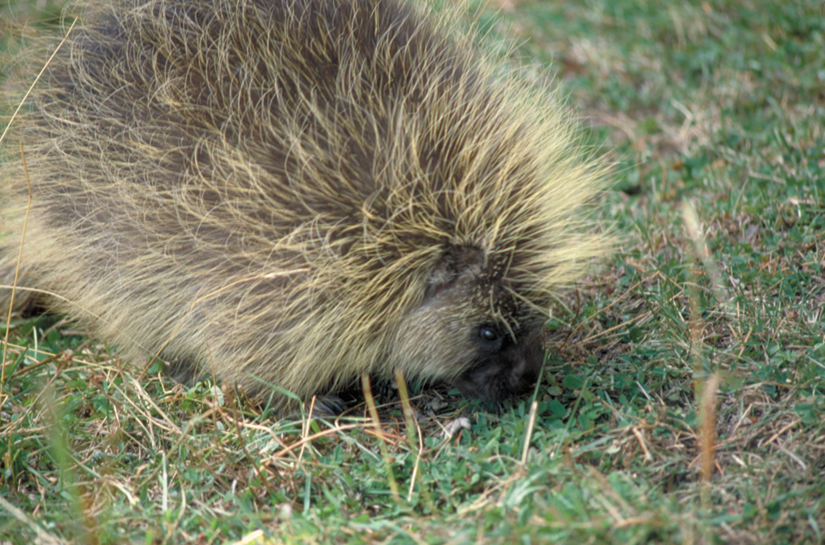
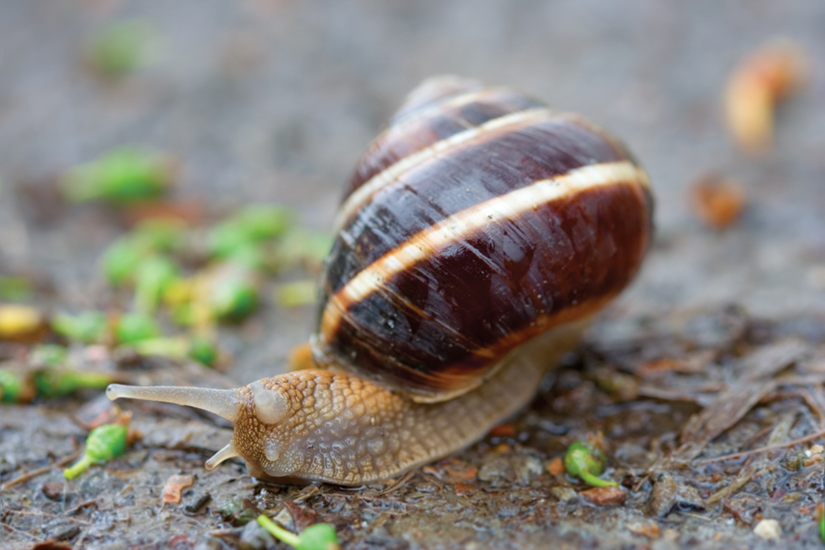
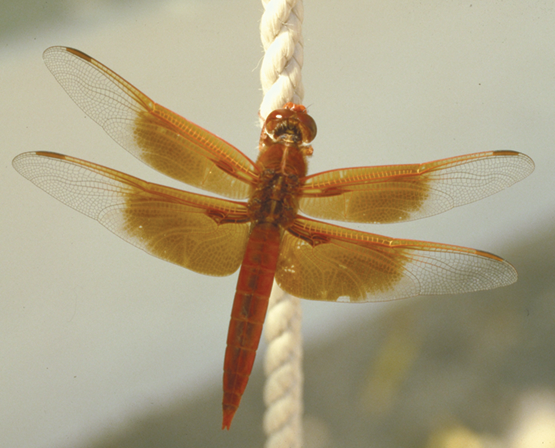
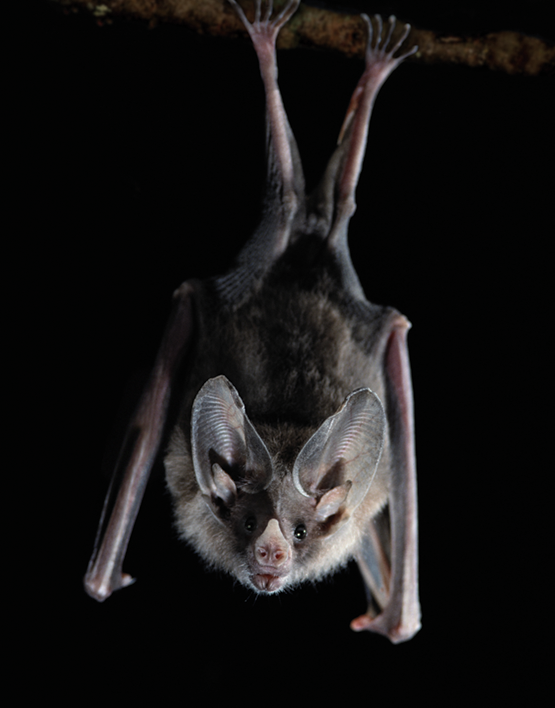
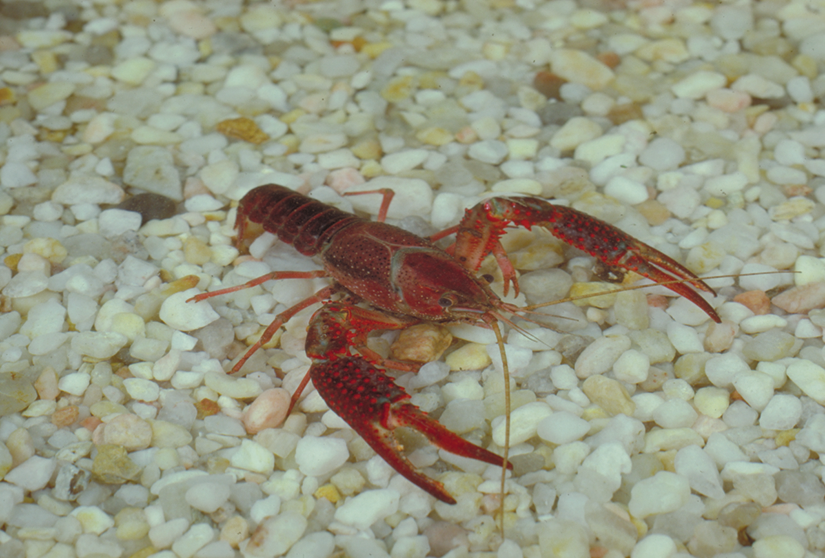
- Working in groups of two, examine the organisms depicted in the pictures shown below (Figures 8-6–8-18).

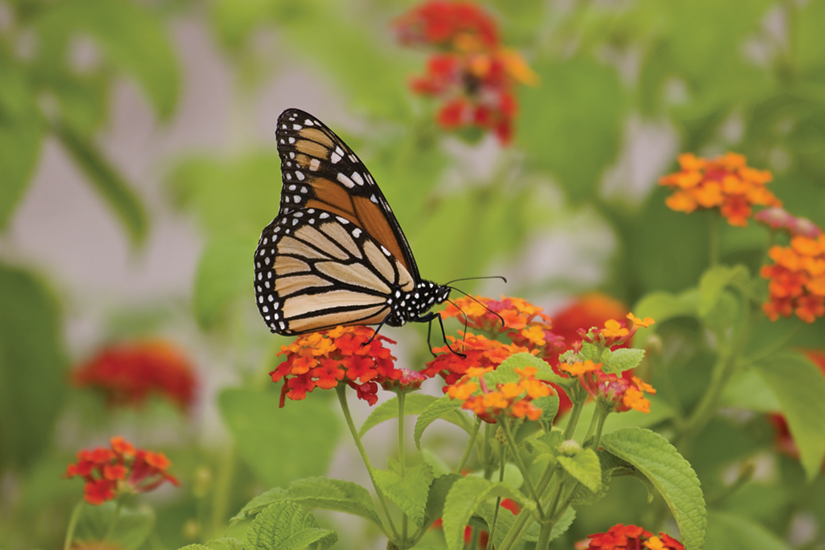
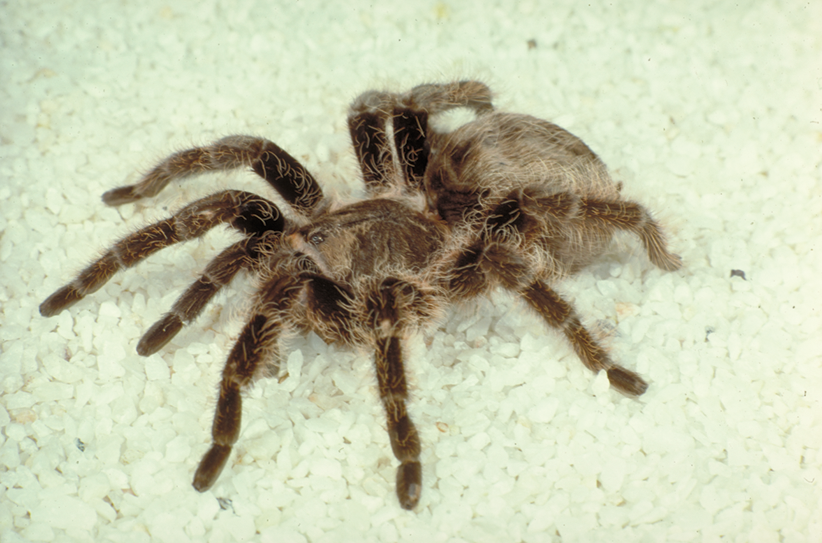
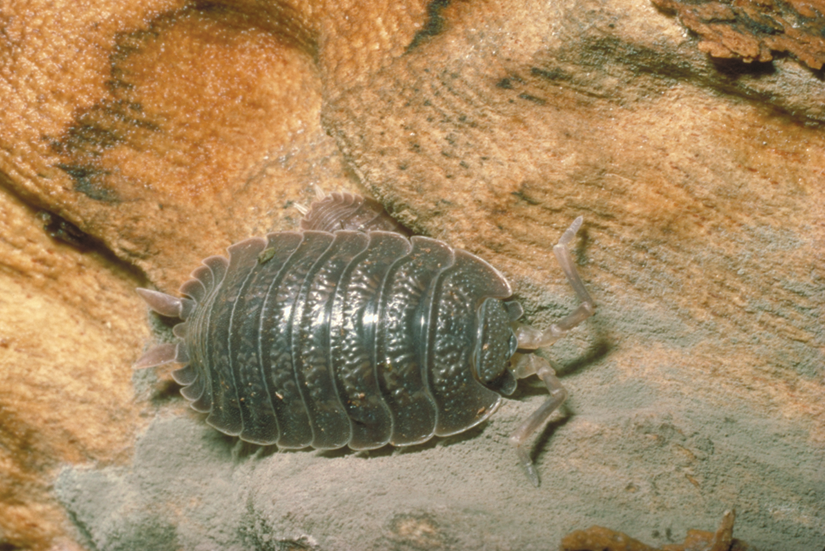
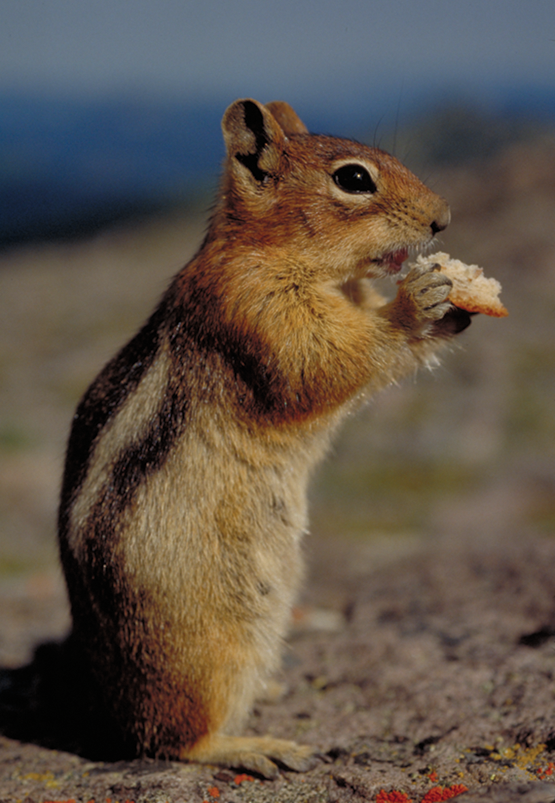

- In your laboratory notebook, make a table using Table 8-1 as a template.
Table 8-1. List of analogous and homologous traits.
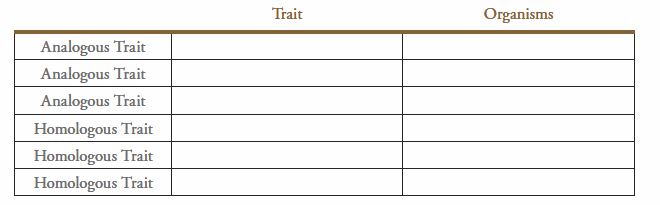
- List three examples of analogous traits and the pairs of organisms that share the analogous trait examples you have chosen. Note that the pairs of organisms don’t have to be the same for the three separate examples of analogous traits.
- List three examples of homologous traits and the pairs of organisms that share the homologous trait examples you have chosen. Note that the pairs of organisms don’t have to be the same for the three separate examples of homologous traits.
- Using the phylogenetic tree shown in Figure 8-19, reevaluate your choices. Does the evolutionary information change which organisms that were chosen for analogous or homologous traits?
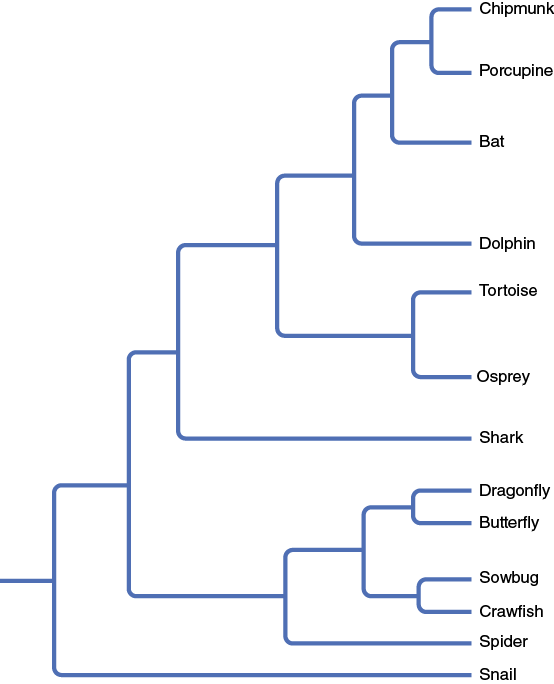
Exercise 3. The Great Clade Race (D. W. Goldsmith, 2003. Amer. Biol. Teacher, 9: 679–682)
General Purpose
Conceptual
- Be able to understand what a phylogenetic tree represents in terms of evolutionary history.
- Be able to interpret a tree without being distracted by taxon order.
- Be able to make inferences about character evolution from phylogenetic trees.
In this exercise you will explore a metaphor that captures some, but not all, of the issues involved in reconstructing phylogenies. Imagine a race through a forest with eight runners (A–H). All the runners start at a single starting line but at various places the course forks (only two branches per fork), and runners are free to choose either path. To help keep track of the race, each runner carries a card that gets stamped at check-in stations distributed on the straight line portions of the course. Runners are obligated to collect a stamp from each check-in station they pass (each check-in station uses only one stamp). All eight runners finish the race carrying their cards, but they each cross a different finishing line. Runners cannot go backwards on the course.
Challenge 1.
On your bench you will find a set of the eight cards (A–H) collected from the runners after the race. Working in groups use these cards to try and reconstruct the course and the placement of check-in stations.
Draw your map of the course in your laboratory notebook. At the end of lab you will hand in a copy of your map. Label the starting point, each check-in station, and each endpoint. When you are done, copy it onto the overhead transparency provided.
Answer the following questions in your laboratory notebook:
What principles did you use in generating your map?
Compare your map to those generated by other groups. How are they similar? How do they differ?
Consider the analogy between the great clade race and biological evolution.
What are the biological analogs of:
a. The runners
b. The check-in stations
c. The race course
Challenge 2.
You will be given a ninth card carried by an additional runner. Decide on the best place to fit this runner into the course map you generated earlier and mark that place.
In your laboratory notebook describe how you picked the position for the ninth runner among the various possible options?
List two explanations for how this ninth runner could have obtained the set of stamps she did. In both cases try and explain the biological analog of the phenomenon you invoke.
Exercise 4. Fantastiflora Phylogeny
The preceding exercise is entirely non-biological and, therefore, unrealistic in some important regards. Most importantly we are told that the runners started with blank cards and thus knew that two runners sharing a stamp passed through the same check-in station. We also knew that a lack of a stamp was ancestral to the presence of a stamp. In biological situations we see variation among species but we generally do not know which traits are ancestral. To give you a feel for biological examples, we will now explore the phylogeny of several species of Fantastiflora, virtual plants that we have “evolved” in the laboratory.
Challenge 1.
Generate a morphological data matrix for phylogenetic analysis of Fantastiflora. The variation among species can be used to infer the phylogeny of those species. In order to do this explicitly, it is usually necessary to represent the variation among the species as a matrix of characters whose states vary among taxa. For example, among big cats the character “coat pattern” could take on the character-states: “solid,” “spotted,” or “striped.”
Use the information below to determine the following characters for each species of Fantastiflora.
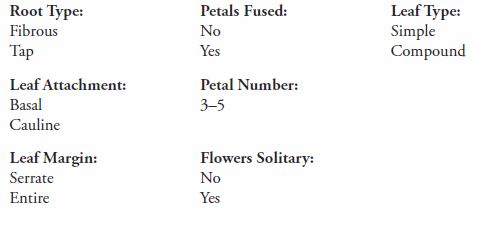
In your laboratory manual make a table using Table 8-2 as a template.
Table 8-2. Character matrix table for species of Fantastiflora.
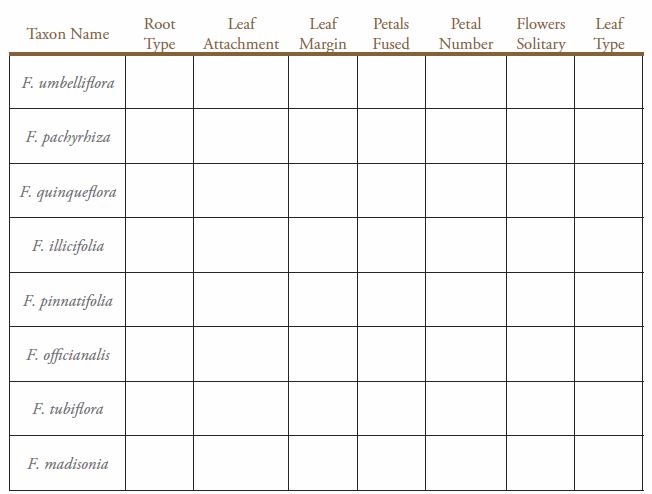
Complete the table by writing the characters in the appropriate boxes to generate a morphological data matrix for phylogenetic analysis of Fantastiflora.
Use the data in the matrix and the cards of the plants to map the phylogeny of these plants. Do this in a way similar to the clade race runners. In your laboratory notebook draw your classification and turn in a copy at the end of lab.
Answer the following question in your laboratory notebook:
What characteristics did you use to classify the plants?
Why did you choose these characteristics?
Exercise 5. Fantastiflora Phylogeny Molecular Analysis
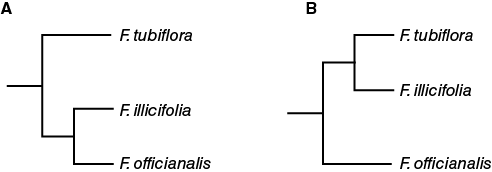
The results of Exercise 4 should demonstrate that multiple phylogenies could be drawn based on the characteristics you chose as the ancestral traits. Segregating plants initially by root type produces a different phylogenic tree than when plants are classified first by leaf morphology and secondly, by root type. You might have classified F. illicifolia and the F. tubiflora together because both have serrated leaves. F. officianalis would then be the plant which is the most distantly related. Alternatively, you could have decided F. illicifolia and the F. officianalis are more closely related because of their similar flower structure.
It is often difficult to determine which morphological traits should be primarily considered to have arisen first in making a phylogenetic tree. DNA sequence analysis has therefore replaced morphological traits as the primary type of data used to determine evolutionary relationships between species today. In the simplest models, it is assumed that the rate of overall DNA nucleotide substitutions (mutations) is constant across time. Greater sequence variation between two species indicates greater evolutionary distance than if the sequences are very similar. The shorter the evolutionary distance, the more closely related two species are proposed to be. Table 8-3 shows nucleotide sequence information for three Fantastiflora species.
Table 8-3. Sequence data for Fantastiflora species.
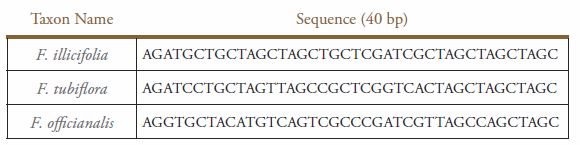
Using the nucleotide sequences in Table 8-3, determine the number of genetic differences (nucleotide substitutions) between each pair of species. Record the number of differences in your laboratory notebook.
F. illicifolia compared to F. officianalis:
F. tubiflora compared to F. officianalis:
F. illicifolia compared to F. tubiflora:
Based on the number of genetic differences between the species pairs, which of the phylogenetic trees shown in Figure 8-20 is correct?
Post-Lab Quiz
Proceed to Post-Lab Quiz