Sample pie chart
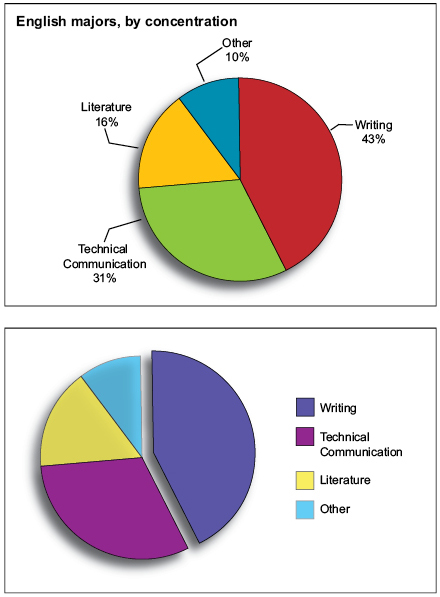
The top pie chart presents the data numerically, with a percentage attached to each slice of the pie. The bottom chart, an exploded pie chart, emphasizes one slice and provides no numerical data. Readers can make conclusions based on the relative sizes of the slices rather than on numbers.
Go to related page: Types of visuals to suit your purpose