Sample bar graph 2
Bar graph with two variables
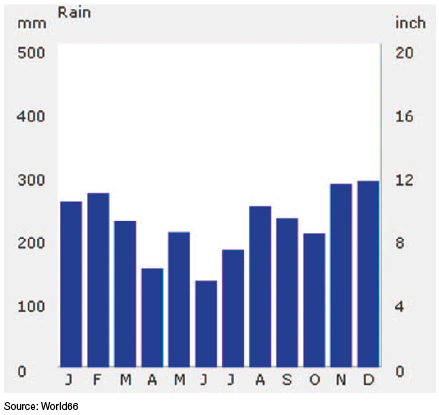
This bar graph shows two variables: time of year by month (horizontal or x-axis) and rainfall in inches and millimeters (vertical or y-axis).
Go to related page: Types of visuals to suit your purpose
Bar graph with two variables
This bar graph shows two variables: time of year by month (horizontal or x-axis) and rainfall in inches and millimeters (vertical or y-axis).
Go to related page: Types of visuals to suit your purpose