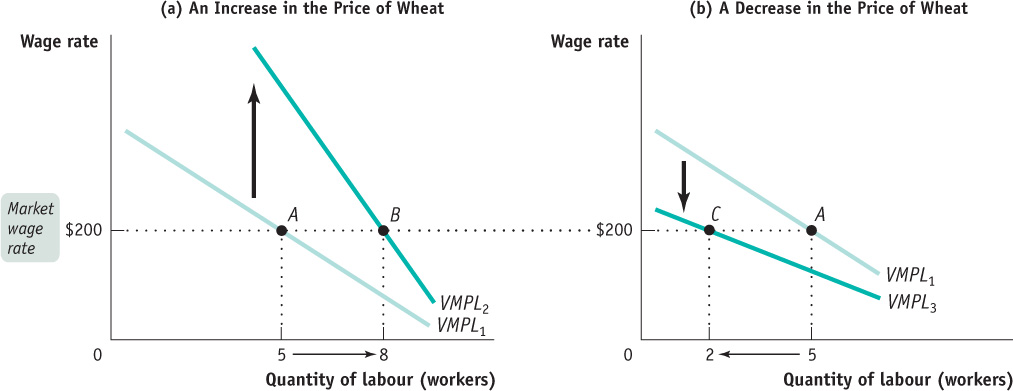
Figure19-4Shifts of the Value of the Marginal Product Curve Panel (a) shows the effect of an increase in the price of wheat on Alec and Janet’s demand for labour. The value of the marginal product of labour curve shifts upward, from VMPL1 to VMPL2. If the market wage rate remains at $200, profit-maximizing employment rises from 5 workers to 8 workers, shown by the movement from point A to point B. Panel (b) shows the effect of a decrease in the price of wheat. The value of the marginal product of labour curve shifts downward, from VMPL1 to VMPL3. At the market wage rate of $200, profit-maximizing employment falls from 5 workers to 2 workers, shown by the movement from point A to point C.