10.5 PROBLEMS
Question 10.1
For each of the following situations, draw a diagram containing three of Isabella’s indifference curves.
For Isabella, cars and tires are perfect complements, but in a ratio of 1:4; that is, for each car, Isabella wants exactly four tires. Be sure to label and number the axes of your diagram. Place tires on the horizontal axis and cars on the vertical axis.
Isabella gets utility only from her caffeine intake. She can consume Valley Dew or cola, and Valley Dew contains twice as much caffeine as cola. Be sure to label and number the axes of your diagram. Place cola on the horizontal axis and Valley Dew on the vertical axis.
Isabella gets utility from consuming two goods: leisure time and income. Both have diminishing marginal utility. Be sure to label the axes of your diagram. Place leisure on the horizontal axis and income on the vertical axis.
Isabella can consume two goods: skis and bindings. For each ski she wants exactly one binding. Be sure to label and number the axes of your diagram. Place bindings on the horizontal axis and skis on the vertical axis.
Isabella gets utility from consuming coffee. But she gets no utility from consuming water: any more, or any less, water leaves her total utility level unchanged. Be sure to label the axes of your diagram. Place water on the horizontal axis and coffee on the vertical axis.
Question 10.2
Use the four properties of indifference curves for ordinary goods illustrated in Figure 10A-4 to answer the following:
Can you rank the following two bundles? If so, which property of indifference curves helps you rank them?
Bundle A: 2 movie tickets and 3 cafeteria meals
Bundle B: 4 movie tickets and 8 cafeteria meals
Can you rank the following two bundles? If so, which property of indifference curves helps you rank them?
Bundle A: 2 movie tickets and 3 cafeteria meals
Bundle B: 4 movie tickets and 3 cafeteria meals
Can you rank the following two bundles? If so, which property of indifference curves helps you rank them?
Bundle A: 12 videos and 4 bags of chips
Bundle B: 5 videos and 10 bags of chips
Suppose you are indifferent between the following two bundles:
Bundle A: 10 breakfasts and 4 dinners
Bundle B: 4 breakfasts and 10 dinners
Now compare bundle A and the following bundle:
Bundle C: 7 breakfasts and 7 dinners
Can you rank bundle A and bundle C? If so, which property of indifference curves helps you rank them? (Hint: It may help if you draw this, placing dinners on the horizontal axis and breakfasts on the vertical axis. And remember that breakfasts and dinners are ordinary goods.)
Question 10.3
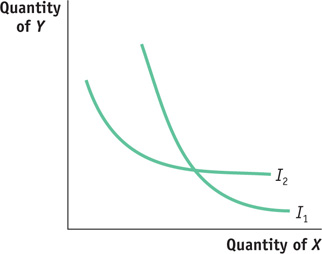
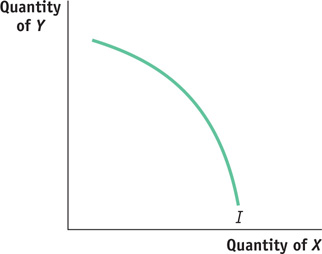
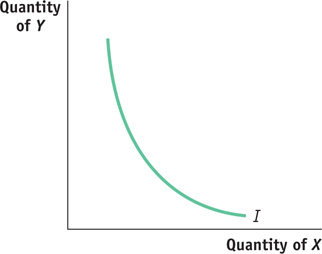
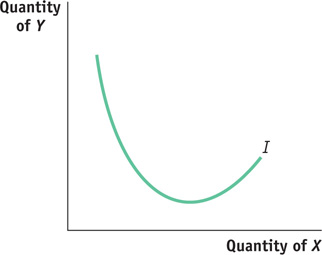
The four properties of indifference curves for ordinary goods illustrated in Figure 10A-4 rule out certain indifference curves. Determine whether those general properties allow each of the following indifference curves. If not, state which of the general principles rules out the curves.
Question 10.4
Restaurant meals and housing (measured by the number of rooms) are the only two goods that Neha can buy. She has an income of $1000, and the price of each room is $100. The relative price of 1 room in terms of restaurant meals is 5. How many restaurant meals can she buy if she spends all her money on them?
Question 10.5
Answer the following questions based on two assumptions: (1) Inflation increases the prices of all goods by 20%. (2) Ina’s income increases from $50 000 to $55 000.
Has Ina’s budget line become steeper, less steep, or equally as steep?
Has Ina’s budget line shifted outward, inward, or not at all?
Question 10.6
Kory has an income of $50, which she can spend on two goods: CDs and cups of hot chocolate. Both are normal goods for her. Each CD costs $10, and each cup of hot chocolate costs $2. For each of the following situations, decide whether this is Kory’s optimal consumption bundle. If not, what should Kory do to achieve her optimal consumption bundle?
Kory is considering buying 4 CDs and 5 cups of hot chocolate. At that bundle, her marginal rate of substitution of CDs in place of hot chocolate is 1; that is, she would be willing to forgo only 1 cup of hot chocolate to acquire 1 CD.
Kory is considering buying 2 CDs and 15 cups of hot chocolate. Kory’s marginal utility of the second CD is 25, and her marginal utility of the fifteenth cup of hot chocolate is 5.
Kory is considering buying 1 CD and 10 cups of hot chocolate. At that bundle, her marginal rate of substitution of CDs in place of hot chocolate is 5; that is, she would be just willing to exchange 5 cups of hot chocolate for 1 CD.
Question 10.7
Siu Bo has 4 Wayne Gretzky and 2 Guy Lafleur hockey cards. The prices of these hockey cards are $24 for Gretzky and $12 for Lafleur. Siu Bo, however, would be willing to exchange 1 Gretzky card for 1 Lafleur card.
What is Siu Bo’s marginal rate of substitution of Wayne Gretzky in place of Guy Lafleur hockey cards?
Can Siu Bo buy and sell hockey cards to make herself better off? How?
Suppose Siu Bo has traded hockey cards and after trading still has some of each kind of card. Also, she now no longer wants to make any more trades. What is her marginal rate of substitution of Wayne Gretzky in place of Guy Lafleur cards now?
Question 10.8
Ralph and Lauren are talking about how much they like going to the gym and how much they like eating out at their favourite restaurant and they regularly do some of each. A session at the gym costs the same as a meal at the restaurant. Ralph says that, for his current consumption of gym sessions and restaurant meals, he values 1 more meal twice as much as he values 1 more session at the gym. Lauren is studying economics, and she tells him that his current consumption bundle cannot be optimal.
Is Lauren right? Why or why not? Draw a diagram of Ralph’s budget line and the indifference curve that he is on by making his current consumption choice. Place restaurant meals on the horizontal axis and gym sessions on the vertical axis.
How should Ralph adjust his consumption so that it is optimal? Illustrate an optimal choice in your diagram.
Question 10.9
Sabine can’t tell the difference between Coke and Pepsi—
What is Sabine’s marginal rate of substitution of Coke in place of Pepsi?
Draw a few of Sabine’s indifference curves for Coke and Pepsi. Place Coke on the horizontal axis and Pepsi on the vertical axis.
Sabine has $6 to spend on cola this week. Coke costs $1.50 per six-
pack and Pepsi costs $1.00. Draw Sabine’s budget line for Coke and Pepsi on the same diagram. What is Sabine’s optimal consumption bundle? Show this on your diagram.
If the price of Coke and Pepsi is the same, what combination of Coke and Pepsi will Sabine buy?
Question 10.10
For Norma, both nachos and salsa are normal goods. They are also ordinary goods for Norma. The price of nachos rises, but the price of salsa remains unchanged.
Can you determine definitively whether she consumes more or fewer nachos? Explain with a diagram, placing nachos on the horizontal axis and salsa on the vertical axis.
Can you determine definitively whether she consumes more or less salsa? Explain with a diagram, placing nachos on the horizontal axis and salsa on the vertical axis.
Question 10.11
Tyrone is a utility maximizer. His income is $100, which he can spend on cafeteria meals and on notepads. Each meal costs $5, and each notepad costs $2. At these prices Tyrone chooses to buy 16 cafeteria meals and 10 notepads.
Draw a diagram that shows Tyrone’s choice using an indifference curve and his budget line, placing notepads on the vertical axis and cafeteria meals on the horizontal axis. Label the indifference curve I1 and the budget line BL1.
The price of notepads falls to $1; the price of cafeteria meals remains the same. On the same diagram, draw Tyrone’s budget line with the new prices and label it BLH.
Lastly, Tyrone’s income falls to $90. On the same diagram, draw his budget line with this income and the new prices and label it BL2. Is he worse off, better off, or equally as well off with these new prices and lower income than compared to the original prices and higher income? (Hint: Determine whether Tyrone can afford to buy his original consumption bundle of 16 meals and 10 notepads with the lower income and new prices.) Illustrate your answer using an indifference curve and label it I2.
Give an intuitive explanation of your answer to part (c).
Question 10.12
Gus spends his income on gas for his car and food. The government raises the tax on gas, thereby raising the price of gas. But the government also lowers the income tax, thereby increasing Gus’s income. And this rise in income is just enough to place Gus on the same indifference curve as the one he was on before the price of gas rose. Will Gus buy more, less, or the same amount of gas as before these changes? Illustrate your answer with a diagram, placing gas on the horizontal axis and food on the vertical axis.
Question 10.13
Pam spends her money on bread and Spam, and her indifference curves obey the four properties of indifference curves for ordinary goods. Suppose that, for Pam, Spam is an inferior, but not a Giffen, good; bread is a normal good. Bread costs $2 per loaf, and Spam costs $2 per can. Pam has $20 to spend.
Draw a diagram of Pam’s budget line, placing Spam on the horizontal axis and bread on the vertical axis. Suppose her optimal consumption bundle is 4 cans of Spam and 6 loaves of bread. Illustrate that bundle and draw the indifference curve on which it lies.
The price of Spam falls to $1; the price of bread remains the same. Pam now buys 7 loaves of bread and 6 cans of Spam. Illustrate her new budget line and new optimal consumption bundle in your diagram. Also draw the indifference curve on which this bundle lies.
In your diagram, show the income and substitution effects from this fall in the price of Spam. Remember that Spam is an inferior good for Pam.
Question 10.14
Katya commutes to work. She can either use public transport or her own car. Her indifference curves obey the four properties of indifference curves for ordinary goods.
Draw Katya’s budget line with car travel on the vertical axis and public transport on the horizontal axis. Suppose that Katya consumes some of both goods. Draw an indifference curve that helps you illustrate her optimal consumption bundle.
Now the price of public transport falls. Draw Katya’s new budget line.
For Katya, public transport is an inferior, but not a Giffen, good. Draw an indifference curve that illustrates her optimal consumption bundle after the price of public transport has fallen. Is Katya consuming more or less public transport?
Show the income and substitution effects from this fall in the price of public transport.
Question 10.15
For Crandall, cheese cubes and crackers are perfect complements: he wants to consume exactly 1 cheese cube with each cracker. He has $2.40 to spend on cheese and crackers. One cheese cube costs 20 cents, and 1 cracker costs 10 cents. Draw a diagram, with crackers on the horizontal axis and cheese cubes on the vertical axis, to answer the following questions.
Which bundle will Crandall consume?
The price of crackers rises to 20 cents. How many cheese cubes and how many crackers will Crandall consume?
Show the income and substitution effects from this price rise.
Question 10.16
Carmen consumes nothing but cafeteria meals and CDs. Her indifference curves exhibit the four general properties of indifference curves. Cafeteria meals cost $5 each, and CDs cost $10. Carmen has $50 to spend.
Draw Carmen’s budget line and an indifference curve that illustrates her optimal consumption bundle. Place cafeteria meals on the horizontal axis and CDs on the vertical axis. You do not have enough information to know the specific tangency point, so choose one arbitrarily.
Now Carmen’s income rises to $100. Draw her new budget line on the same diagram, as well as an indifference curve that illustrates her optimal consumption bundle. Assume that cafeteria meals are an inferior good.
Can you draw an indifference curve showing that cafeteria meals and CDs are both inferior goods?
Question 10.17
The Japanese Ministry of Internal Affairs and Communications collects data on the prices of goods and services in the Ku-
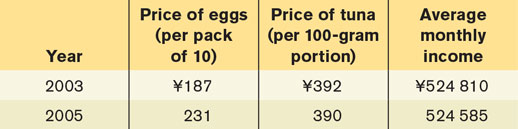
For each of the two years for which you have data, what is the maximum number of packs of eggs that an average Japanese household could have consumed each month? The maximum number of 100-gram portions of tuna? In one diagram, draw the average Japanese household’s budget line in 2003 and in 2005.
Calculate the relative price of eggs in terms of tuna for each year. Use the relative price rule to determine how the average household’s consumption of eggs and tuna would have changed between 2003 and 2005.