18.1 Poverty, Inequality, and Public Policy
The welfare state is the collection of government programs designed to alleviate economic hardship.
During World War II, a British clergyman gave a speech in which he contrasted the “warfare state” of Nazi Germany, dedicated to conquest, with Britain’s “welfare state,” dedicated to serving the welfare of its people. Since then, the term welfare state has come to refer to the collection of government programs that are designed to alleviate economic hardship. A large share of the government spending of all wealthy countries consists of government transfers—payments by the government to individuals and families—
A government transfer is a government payment to an individual or a family.
The Logic of the Welfare State
There are three major economic rationales for the creation of the welfare state. We’ll turn now to a discussion of each.
1. Alleviating Income Inequality Suppose that the Taylor family, which has an income of only $15 000 a year, were to receive a government cheque for $1500. This cheque might allow the Taylors to afford a better place to live, eat a more nutritious diet, or in other ways significantly improve their quality of life. Also suppose that the Fisher family, which has an income of $300 000 a year, were to face an extra tax of $1500. This probably wouldn’t make much difference to their quality of life: at worst, they might have to give up a few minor luxuries.
A social welfare program is a government program designed to provide payments based on need.
This hypothetical exchange illustrates the first major rationale for the welfare state: alleviating income inequality. Because a marginal (or additional) dollar is worth more to a poor person than a rich one, modest transfers from the rich to the poor will do the rich little harm but benefit the poor a lot. So, according to this argument, a government that plays Robin Hood, taking from the rich to give to those in need, does more good than harm. Programs that are designed to provide payments based on need are known as social welfare programs.
A social insurance program is a government program designed to provide protection against unpredictable financial distress.
2. Alleviating Economic Insecurity The second major rationale for the welfare state is alleviating economic insecurity. Imagine ten families, each of which can expect an income next year of $50 000 if nothing goes wrong. But suppose the odds are that something will go wrong for one of the families, although nobody knows which one. For example, suppose each of the families has a one in ten chance of experiencing a sharp drop in income because one family member is laid off or incurs large medical bills. And assume that this event will produce severe hardship for the family—
These two rationales for the welfare state, alleviating income inequality and alleviating economic insecurity, are closely related to the ability-
3. Reducing Poverty and Providing Access to Health Care The third and final major rationale for the welfare state involves the social benefits of poverty reduction and access to health care, especially when applied to children of poor households. Researchers have documented that such children, on average, suffer lifelong disadvantages. As we saw in the Economics in Action in Chapter 16, The Impeccable Economic Logic of Early-
More broadly, as the following For Inquiring Minds explains, some political philosophers argue that principles of social justice demand that society take care of the poor and unlucky. Others disagree, arguing that welfare state programs go beyond the proper role of government. To an important extent, the difference between those two philosophical positions defines what we mean in politics by “liberalism” and “conservatism.”
But before we get carried away, it’s important to realize that things aren’t quite that cut and dried. Even conservatives who believe in limited government typically support some welfare state programs. And even economists who support the goals of the welfare state are concerned about the effects of large-
JUSTICE AND THE WELFARE STATE
In 1971 American philosopher John Rawls published A Theory of Justice, the most famous attempt to date to develop a theory of economic fairness. He asked readers to imagine deciding economic and social policies behind a “veil of ignorance” about their own identity. That is, suppose you knew you would be a human being but did not know whether you would be rich or poor, healthy or sick, and so on. Rawls argued that the policies that would emerge if people had to make decisions behind the veil of ignorance define what we mean by economic justice. It’s sort of a generalized version of the Golden Rule: do unto others as you would have them do unto you if you were in their place.
Rawls further argued that people behind the veil of ignorance would choose policies that placed a high value on the well-
Three years after Rawls published his book, another American philosopher, Robert Nozick, published Anarchy, State, and Utopia, which is often considered the libertarian response. Nozick argued that justice is a matter of rights, not results, and that the government has no right to force people with high incomes to support others with lower incomes. He argued for a minimal government that enforces the law and provides security—
Philosophers, of course, don’t run the world. But real-
The Problem of Poverty
Poverty is a social problem that governments around the world try to fight, by assisting the poor and those at risk of becoming poor. Governments in Canada attempt to reduce poverty through the provision of various social welfare and insurance programs such as employment insurance, affordable housing programs, income support, and other programs to alleviate the problems associated with poverty. Together these programs are collectively referred to as social programs.
The poverty line (or poverty threshold) is the annual income below which a family is considered poor.
But what, exactly, do we mean by poverty? Any definition is somewhat arbitrary. In Canada the poverty line (or poverty threshold) is the minimum level of income considered adequate to purchase the necessities of life. Anyone who falls below the poverty line is considered to be in a state of poverty. Although there is no official definition of the poverty line, Statistics Canada constructs the low income cut-
Although the LICOs are the most commonly used criterion to measure poverty in Canada, other measures such as the low-
An absolute measure, which defines an amount of money a family or individual needs, is the alternative to a relative measure. The market basket measure (MBM), developed by Human Resources and Skills Development Canada, is an absolute measure of poverty. The MBM is a measure of low income based on the cost of a specific basket of goods and services for a family with two adults aged between 25 and 49 and two children aged between 9 and 13.
The poverty line depends on the size of a family and the size of the community. Using the after-
The poverty rate is the percentage of the population with incomes below the poverty threshold.
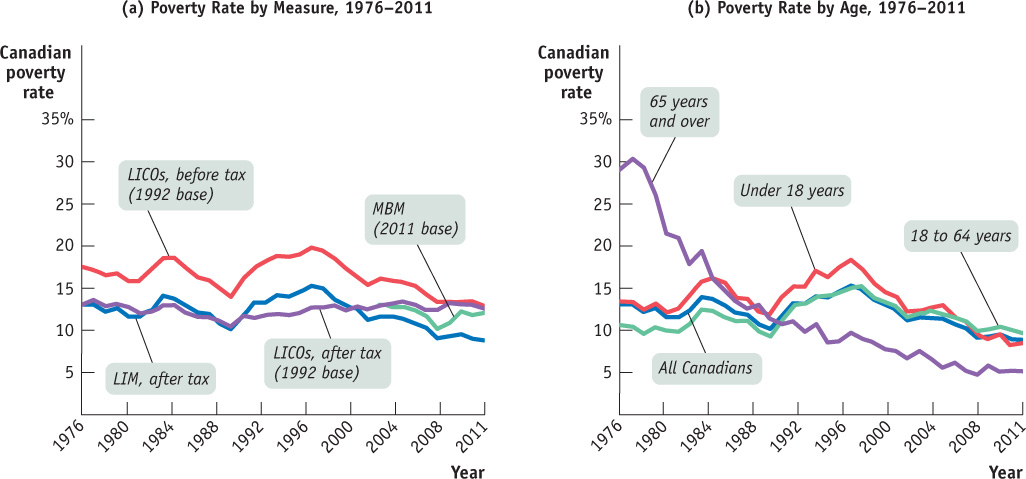
Trends in Poverty Based on conventional wisdom, you might expect that as the economy grows and becomes more prosperous, and as average income rises, the percentage of the population living below the poverty line would decline steadily. Is that the case in Canada? Let’s see. Panel (a) of Figure 18-1 shows the poverty rate—the percentage of the population below the poverty line—
Panel (b) shows the poverty rate by age group using the after-
Who Are the Poor? Who are the poor in Canada? Obvious answers are likely to be the single-
In 2011, according to the after-
There is a correlation between family makeup and poverty: families with a woman as the major income earner had a higher chance of living in poverty—
Based on the 2006 census data and using the LIM to measure poverty, a 2013 report by the Canadian Centre for Policy Alternatives (CCPA) showed that poverty rates among the First Nations were significantly higher than among other ethnic groups in Canada. Even worse, half of the status First Nations children in Canada lived in poverty, compared to a 15% poverty rate for all other children in the country (the average poverty rate for all children in Canada was 17%).
POOR PEOPLE IN RICH COUNTRIES
How does Canada’s poverty problem compare with the situation in other wealthy countries? The answer depends, in part, on the definition of poverty.
The figure shows poverty rates in 2000 in five rich countries, under two definitions. One definition, which is widely used in international comparisons, defines someone as poor if that person lives in a household with an income that is less than half his or her country’s median income, the low income measure (LIM) defined earlier. This is a relative definition of poverty. As the orange bars in the figure show, by this measure Canada was in the middle of the pack compared with other rich nations.
One objection to the relative definition of poverty is that Canada is richer than some other rich countries. Canada has about the same median income as the United Kingdom and a somewhat higher median income than Sweden and Germany. Does Canada still have high poverty when this is taken into account? The purple bars use a measure of absolute poverty, the minimum annual income that is considered adequate. By this definition, Canada has the lowest poverty rate. Thus, depending on the measure of poverty used, Canada’s poverty rate may be considered to be high or low.
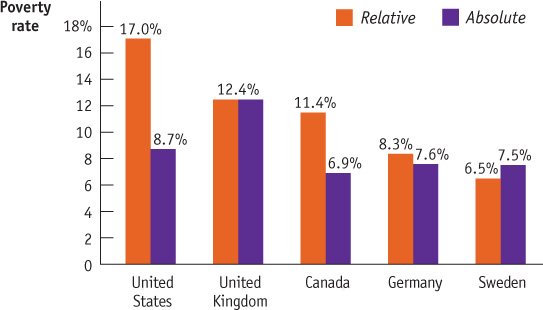
Source: Timothy Smeeding, “Poor People in Rich Nations: The United States in Comparative Perspective,” Journal of Economic Perspectives 20, no. 1 (2006): 69–90.
Another study by the CCPA showed that race played a role in determining the likelihood of an individual living in poverty.1 Once again, using the 2006 census data for Ontario, the report found that visible minority families were three times as likely to live under the poverty line as families who did not consider themselves as visible minority (for visible minority families the poverty rate was 18.7%, compared to 6% for non-
What really stands out in the data is the number of Canadians moving above or below the poverty line. From 2009 to 2010, the number of individuals remaining below the poverty line was 1.52 million. At the same time, 0.889 million individuals moved out from under the poverty line and 0.78 million individuals fell below it. Individuals without a university degree were more likely to remain poor and to become the poor. Among those who remained poor, about 70% didn’t have a post-
What Causes Poverty? Poverty is often blamed on lack of education, and educational attainment clearly has a strong positive effect on income level—
Lack of proficiency in English or French is also a barrier to higher income. For example, immigrants to Alberta with poor English skills are more likely to work for minimum wage in industries like retail and manufacturing, which offer temporary jobs and are more susceptible to economic fluctuations. Even for immigrants who are proficient in English, finding a decent job may not be easy if they lack connections and Canadian experience.
And it’s important not to overlook the role of racial and gender discrimination; although less pervasive today than 50 years ago, discrimination still erects formidable barriers to advancement for many Canadians. Visible minorities earn less and are less likely to be employed than whites with comparable levels of education. Studies find that visible minorities and Aboriginals suffer persistent discrimination by employers. Women earn lower incomes than men with similar qualifications.
In addition, one important source of poverty that should not be overlooked is bad luck. Many families find themselves impoverished when a wage-
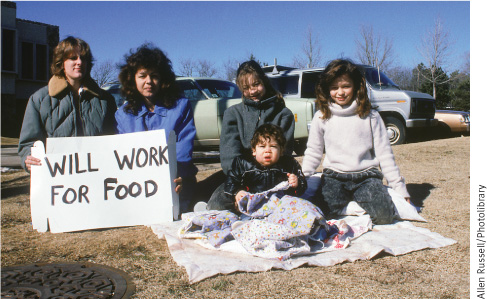
Consequences of Poverty The consequences of poverty are often severe, particularly for children. In 2011, 8.5% of children in Canada lived in poverty; this is using the after-
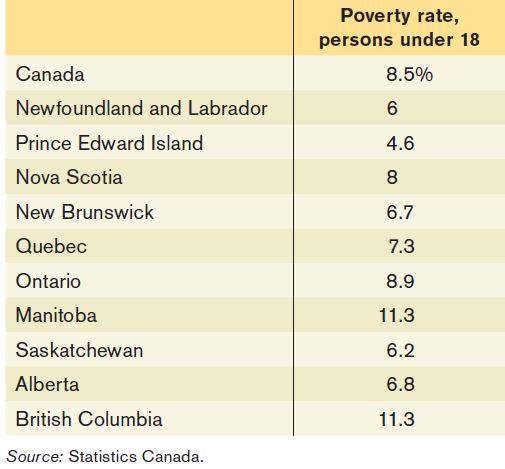
To make things worse, the problems of child poverty do not hit the country evenly. Some provinces have higher child poverty rates than others. Table 18-1 shows the provincial child poverty rates in 2011 using the after-
Similarly, some ethnic groups are more likely to live in poverty than others. As mentioned earlier, a report by the Canadian Centre for Policy Alternatives showed that half of First Nations children were living in poverty in 2013. This disturbingly high child poverty rate explains, to some extent, why Aboriginal children were behind non-
Economic Inequality
Canada is a rich country. In 2007, the year prior to the recent recession, the average income for a Canadian household with at least two people was $93 100 (measured in 2011 dollars), far exceeding the poverty line.3 Even after the 2008–2009 recession, average income rose to $95 000 in 2011. How is it possible, then, that so many Canadians still live in poverty? The answer is that income is unequally distributed, with many households earning much less than the average and others earning much more.
Table 18-2 shows the distribution of pre-
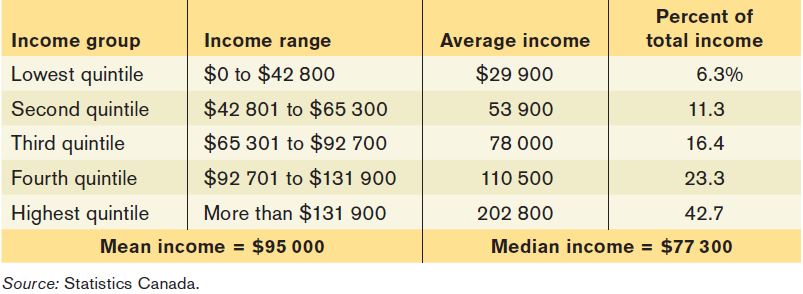
For each group, Table 18-2 shows three numbers. The second column shows the income ranges that define the group. For example, in 2011, the lowest quintile consisted of households with annual incomes of less than $42 800, the next quintile of households had incomes between $42 800 and $65 300, and so on. The third column shows the average level of family income in each group, families in the highest quintiles had an average income of $202 800, almost seven times the average level of income of families in the lowest quintile. The fourth column shows the percentage of total Canadian income received by each group.
Mean household income is the average income across all households.
Mean versus Median Household Income At the bottom of Table 18-2 are two useful numbers for thinking about the incomes of Canadian households. Mean household income, also called average household income, is the total income of all Canadian households divided by the number of households. Median household income is the income of a household in the exact middle of the income distribution—
Median household income is the income of the household lying at the exact middle of the income distribution.
Economists often illustrate the difference by asking people first to imagine a room containing several dozen more or less ordinary wage-
What we learn from Table 18-2 is that income in Canada is quite unequally distributed. The average income earned by the poorest fifth of families is less than 40% of the average income earned by families in the middle, and the average income of the richest fifth is 2.6 times the average income earned by those in the middle. The Economics in Action at the end of this section discusses long-
The Gini coefficient is a number that summarizes a country’s level of income inequality based on how unequally income is distributed across quintiles.
The Gini Coefficient It’s often convenient to have a single number that summarizes a country’s level of income inequality. The Gini coefficient, the most widely used measure of inequality, is based on how disparately income is distributed across the quintiles. A country with a perfectly equal distribution of income—
One way to get a sense of what Gini coefficients mean in practice is to look at international comparisons. Figure 18-2 shows the most recent estimates of the Gini coefficient for many of the world’s countries. Aside from a few countries in Africa, the highest levels of income inequality are found in Latin America, especially Colombia; countries with a high degree of inequality have Gini coefficients close to 0.6. The most equal distributions of income are in Europe, especially in Scandinavia; countries with very equal income distributions, such as Sweden, have Gini coefficients around 0.25. Compared to other wealthy countries, Canada, with a Gini coefficient of 0.365 in 2011 (based on total income for economic families), has high inequality, though it does have the lowest Gini coefficient in all of North and South America.
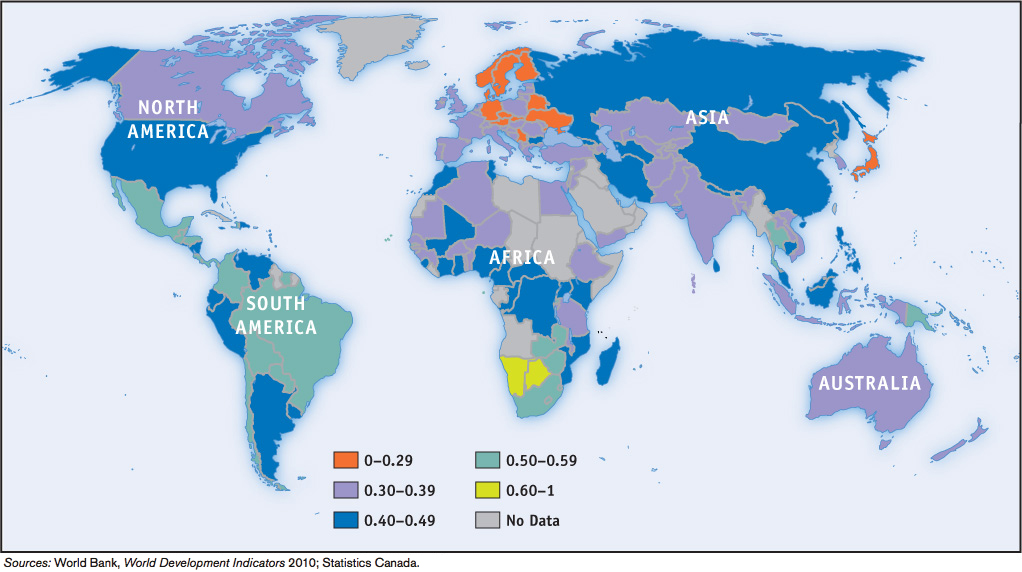
How serious an issue is income inequality? In a direct sense, high income inequality means that some people don’t share in a nation’s overall prosperity. Although the poverty rate in Canada has declined somewhat in the past two decades, the Gini coefficient in the country is relatively stable, indicating that income inequality persists. Also, extreme inequality, as found in Latin America, is often associated with political instability because of tension between a wealthy minority and the rest of the population.
It’s important to realize, however, that the data shown in Table 18-2 overstate the true degree of inequality in Canada, for several reasons. One is that the data represent a snapshot for a single year, whereas the incomes of many individual families fluctuate over time. That is, many of those near the bottom in any given year are having an unusually bad year and many of those at the top are having an unusually good one. Over time, their incomes will revert to a more normal level. So a table showing average incomes within quintiles over a longer period, such as a decade, would not show as much inequality.
Furthermore, a family’s income tends to vary over its life cycle: most people earn considerably less in their early working years than they will later in life, then experience a considerable drop in income when they retire. Consequently, the numbers in Table 18-2, which combine young workers, mature workers, immigrants, and retirees, show more inequality than would a table that compares families of similar ages.
Despite these qualifications, there is a considerable amount of genuine inequality in Canada. In fact, inequality not only persists for long periods of time for individuals, it extends across generations. The children of poor parents are more likely to be poor than the children of affluent parents, and vice versa. Moreover, the fact that families’ incomes fluctuate from year to year isn’t entirely good news. Measures of inequality in a given year do overstate true inequality. But those year-
Economic Insecurity
As we stated earlier, although the rationale for the welfare state rests partly on the social benefits of reducing poverty and inequality, it also rests in part on the benefits of reducing economic insecurity, which afflicts even relatively well-off families.
One form economic insecurity takes is the risk of a sudden loss of income, which usually happens when a family member loses a job and either spends an extended period without work or is forced to take a new job that pays considerably less.
Even if a family doesn’t face a loss in income, it can face a surge in expenses. The most common reason for such surges is a medical problem that requires expensive treatment, such as heart disease or cancer. Canadians receive basic health care coverage from the government, which handles a large share of medical expenses. However, some expensive medications and treatments are not covered and could impose a huge financial burden on a family.
TRENDS IN INCOME INEQUALITY IN CANADA
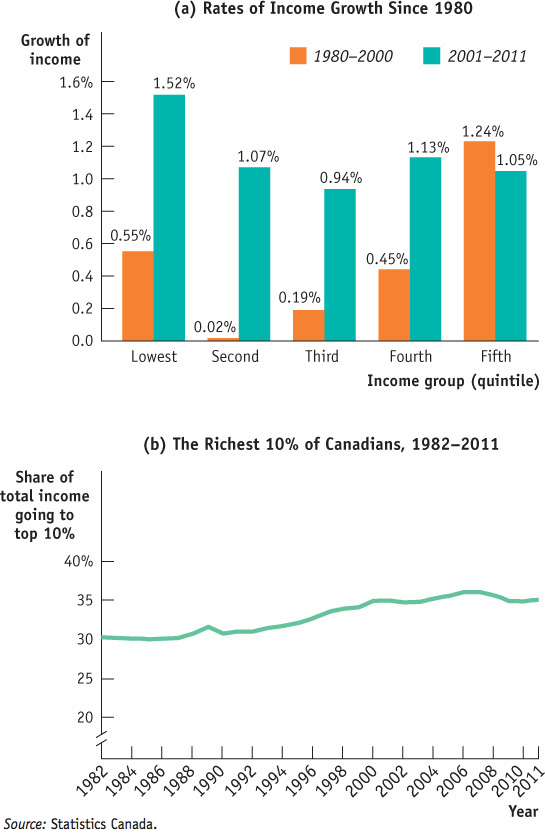
Does inequality tend to rise, fall, or stay the same over time? Let’s take a look. Detailed Canadian data on income by quintiles, as shown in Table 18-2, are only available starting in 1976. Panel (a) of Figure 18-3 shows the annual growth rate of average income for economic families, measured in 2011 dollars, for the five quintiles over two periods: from 1980 to 2000 and from 2000 to 2011. There is a clear difference between the two periods. In the first period, there were larger differences in the growth rates of average real income. Canadian households in higher income groups found their real income increasing between 1980 and 2000; however, households in the middle three quintiles experienced the lowest growth rates in that period. People in the lowest quintile experienced the second highest average growth rate of real income of the quintiles, meaning they were gaining on those in the middle three quintiles (the middle class). But this average growth rate of 0.6% per year was only half the growth rate experienced during this period by those in the top quintile, so those at the top were pulling ahead of all those in every other quintile. The good news is that after 2000, average real income within each group grew at about the same rate—around 1% per year—except for those in the lowest quintile that experienced the highest growth rate of average real income of 1.5% per year. So during this period the poorest 20% of families were gaining on the rest of the income distribution—inequality was declining.
Panel (b) of Figure 18-3 shows the share of total income earned by the top 10% of Canadians between 1982 and 2011. Again we can see that inequality in Canada was rising in the 1980s and 1990s when the share of total income earned by the top 10% of Canadians rose from 30% to 35%, but it then stabilized after 2000 (fluctuating around 35%). The average income earned by the top 10% of Canadians, measured in 2011 dollars, rose from $110 509 in 1982 to $147 100 in 2011, with an annual growth rate of 1.05% between 1982 and 2000 and 0.85% between 2000 and 2011. The lower growth rate of real income after 2000 helps explain why the share of total income earned by the top 10% of Canadians had stabilized in later years.
Many believe the persistence of income inequality is caused by rapid technological change. The demand for highly skilled or talented workers increases more rapidly than the demand for other workers, leading to a rise in the wage gap between the highly skilled and other workers. Growing international trade may also have contributed by allowing Canada to import labour-intensive products from low-wage countries rather than making them domestically, reducing the demand for less skilled Canadian workers and depressing their wages. Rising immigration may be yet another source—on average, immigrants earn lower wages than workers born in Canada.
All these explanations, however, fail to account for one key feature: much of the rise in inequality doesn’t reflect a rising gap between highly educated workers and those with less education but rather growing differences among highly educated workers themselves. For example, teachers and top business executives have similarly high levels of education, but executive paycheques have risen dramatically and teachers’ salaries have not. For some reason, a few “superstars”—a group that includes literal superstars in the entertainment world but also such groups as Bay Street traders and top corporate executives—now earn much higher incomes than was the case a generation ago. It’s still unclear what caused this change.

Quick Review
Welfare state programs, which include government transfers, absorb a large share of government spending in wealthy countries.
The ability-to-pay principle explains one rationale for the welfare state: alleviating income inequality. Social welfare programs do this by aiding those in need. Social insurance programs address the second rationale: alleviating economic insecurity. The external benefits to society of poverty reduction and access to health care is a third rationale for the welfare state.
The poverty rate describes the percentage of people who are below the poverty line (sometimes called the poverty threshold). Although the poverty line is not officially defined in Canada, common measures include the low income cut-offs (LICOs), the low-income measure (LIM), and the market basket measure (MBM).
The causes of poverty can include lack of education, the legacy of racial and gender discrimination, and bad luck. The consequences of poverty are dire especially for children and Aboriginals.
Median household income is a better indicator of typical household income than mean household income. Comparing of Gini coefficients across countries shows that Canada has less income inequality than poor countries but more than some rich countries.
The level of income inequality in Canada has fluctuated over time. The period of 1980 to 2000 saw increased inequality in Canada, but since 2000 the level of inequality has stabilized and declined somewhat.
Check Your Understanding 18-1
CHECK YOUR UNDERSTANDING 18-1
Question 18.1
Indicate whether each of the following programs is a social welfare program or a social insurance program.
A pension guarantee program, which provides pensions for retirees if they have lost their employment-based pension due to their employer’s bankruptcy
The federal program known as the National Child Benefit Supplement (NCBS), which provides a monthly benefit for low-income families with children.
The federal program known as the Universal Child Care Benefit (UCCB), a monthly payment of $100 paid to all families with children under the age of 6.
The federal flood program, which provides financial help to communities hit by major floods
The Canada Mortgage and Housing Corporation (CMHC), which provides affordable housing to low-income families under the Investment in Affordable Housing (IAH) framework
A pension guarantee program is a social insurance program. The possibility of an employer declaring bankruptcy and defaulting on its obligation to pay employee pensions creates insecurity. By providing pension income to those employees, such a program alleviates this source of economic insecurity.
The NCBS program is a social welfare program. By providing funding to children in low-income households, it targets its spending specifically to the poor.
The UCCB program is not a social welfare program. By providing funding to all families with children, rich or poor, it targets its spending specifically to families with children.
The federal flood program is a social insurance program. For many people, the majority of their wealth is tied up in the home they own. The potential for a loss of that wealth creates economic insecurity. By providing assistance to those hit by a major flood, the program alleviates this source of insecurity.
The IAH program is a social welfare program. By targeting its support to low-income households, it specifically helps the poor.
Question 18.2
Is the poverty line, as defined by an after-tax LICO, a relative or an absolute measure of poverty? That is, does it define poverty according to how poor someone is relative to others or according to some fixed measure that doesn’t change over time? Explain.
An after-tax LICO is a relative measure of poverty. The LICOs are income thresholds below which a family is expected to spend too large a share of its income to acquire necessities compared to the average family. The LICOs estimate an income threshold at which families are expected to spend 20 percentage points more than the average family on food, shelter, and clothing. For example, in 2012 using the after-tax LICOs measure the poverty line for a family of four in a community of at least 500 000 residents was $37 052; if this family lived in a community of 100 000 to 499 999 people, it was $31 335. This measure counts about 3 million Canadians as living in poverty, about 1 in eleven people.
Question 18.3
The accompanying table gives the distribution of income for a very small economy.
What is the mean income? What is the median income? Which measure is more representative of the income of the average person in the economy? Why?
What income range defines the first quintile? The third?
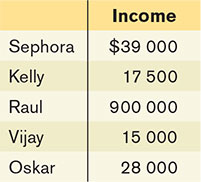
To determine mean (or average) income, we take the total income of all individuals in this economy and divide it by the number of individuals. Mean income is ($39 000 + $17 500 + $900 000 + $15 000 + $28 000)/5 = $999 500/5 = $199 900. To determine median income, look at the accompanying table, which lines up the five individuals in order of their income.
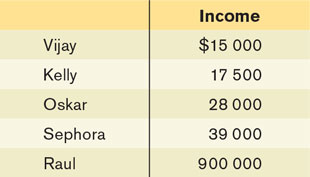
The median income is the income of the individual in the exact middle of the income distribution: Oskar, with an income of $28 000. So the median income is $28 000.
Median income is more representative of the income of individuals in this economy: almost everyone earns income between $15 000 and $39 000, close to the median income of $28 000. Only Raul is the exception: it is his income that raises the mean income to $199 900, which is not representative of most incomes in this economy.
The first quintile is made up of the 20% (or one-fifth) of individuals with the lowest incomes in the economy. Vijay makes up the 20% of individuals with the lowest incomes. His income is $15 000, so that is the average income of the first quintile. Oskar makes up the 20% of individuals with the third-lowest incomes. His income is $28 000, so that is the average income of the third quintile.
Question 18.4
Which of the following statements more accurately reflects the principal source of rising inequality in Canada today?
The salary of the manager of the local branch of Sunrise Bank has risen relative to the salary of the neighbourhood gas station attendant.
The salary of the CEO of Sunrise Bank has risen relative to the salary of the local branch bank manager, who has similar education levels.
As the Economics in Action pointed out, much of the rise in inequality reflects growing differences among highly educated workers. That is, workers with similar levels of education earn very dissimilar incomes. As a result, the principal source of rising inequality in Canada today is reflected by statement b: the rise in the bank CEO’s salary relative to that of the branch manager.