18.7 PROBLEMS
Question 18.15
The accompanying table contains data on the Canadian economy for the years 1980 and 2011. The second column shows the poverty line using the LIM in constant dollars. The third column shows Canada’s GDP per capita, a measure of the real standard of living.
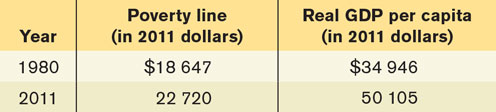
By what factor has the real poverty line increased from 1980 to 2011? For example, has it doubled? Tripled?
By what factor has real GDP per capita increased from 1980 to 2011? For example, has it doubled? Tripled?
What do your results tell you about how those people classified as “poor” have done economically relative to other Canadian citizens?
Question 18.16
In the city of Metropolis, there are 100 residents, each of whom lives until age 75. Residents of Metropolis have the following incomes over their lifetime: Through age 14, they earn nothing. From age 15 until age 29, they earn 200 metros (the currency of Metropolis) per year. From age 30 to age 49, they earn 400 metros. From age 50 to age 64, they earn 300 metros. Finally, at age 65 they retire and are paid a pension of 100 metros per year until they die at age 75. Each year, everyone consumes whatever their income is that year (that is, there is no saving and no borrowing). Currently, 20 residents are 10 years old, 20 residents are 20 years old, 20 residents are 40 years old, 20 residents are 60 years old, and 20 residents are 70 years old.
Study the income distribution among all residents of Metropolis. Split the population into quintiles according to their income. How much income does a resident in the lowest quintile have? In the second, third, fourth, and top quintiles? What share of total income of all residents goes to the residents in each quintile? Construct a table showing the share of total income that goes to each quintile. Does this income distribution show inequality?
Now look only at the 20 residents of Metropolis who are currently 40 years old, and study the income distribution among only those residents. Split those 20 residents into quintiles according to their income. How much income does a resident in the lowest quintile have? In the second, third, fourth, and top quintiles? What share of total income of all 40-year-
olds goes to the residents in each quintile? Does this income distribution show inequality? What is the relevance of these examples for assessing data on the distribution of income in any country?
Question 18.17
The accompanying table presents data from Statistics Canada on median and mean income of male workers for the years 1976 and 2011. The income figures are adjusted to eliminate the effect of inflation.
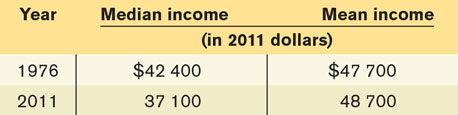
By what percentage has median income changed over this period? By what percentage has mean income changed over this period?
Between 1976 and 2011, has the income distribution become less or more unequal? Explain.
Question 18.18
There are 100 households in the economy of Equalor. Initially, 99 of them have an income of $10 000 each, and one household has an income of $1 010 000.
What is the median income in this economy? What is the mean income?
Through its social welfare programs, the government of Equalor now redistributes income: it takes $990 000 away from the richest household and distributes it equally among the remaining 99 households.
What is the median income in this economy now? What is the mean income? Has the median income changed? Has the mean income changed? Which indicator (mean or median household income) is a better indicator of the typical Equalorian household’s income? Explain.
Question 18.19
The country of Marxland has the following income tax and social insurance system. Each citizen’s income is taxed at an average tax rate of 100%. A social insurance system then provides transfers to each citizen such that each citizen’s after-
Question 18.20
The tax system in Taxilvania includes a negative income tax. For all incomes below $10 000, individuals pay an income tax of –40% (that is, they receive a payment of 40% of their income). For any income above the $10 000 threshold, the tax rate on that additional income is 10%. For the first three scenarios below, calculate the amount of income tax to be paid and after-
Lowani earns income of $8000.
Midram earns income of $40 000.
Hi-
Wan earns income of $100 000. Can you find a notch in this tax system? That is, can you find a situation where earning more pre-
tax income actually results in less after- tax income?
Question 18.21
In the city of Notchingham, each worker is paid a wage rate of $10 per hour. Notchingham administers its own unemployment benefit, which is structured as follows: If you are unemployed (that is, if you do not work at all), you get unemployment benefits (a transfer from the government) of $50 per day. As soon as you work for only one hour, the unemployment benefit is completely withdrawn. That is, there is a notch in the benefit system.
How much income does an unemployed person have per day? How much daily income does an individual who works four hours per day have? How many hours do you need to work to earn just the same as if you were unemployed?
Will anyone ever accept a part-
time job that requires working four hours per day, rather than being unemployed? Suppose that Notchingham now changes the way in which the unemployment benefit is withdrawn. For each additional dollar an individual earns, $0.50 of the unemployment benefit is withdrawn. How much daily income does an individual who works four hours per day now have? Is there an incentive now to work four hours per day rather than being unemployed?
Question 18.22
In a private insurance market, there are two different kinds of people: some who are more likely to require expensive medical treatment and some who are less likely to require medical treatment and who, if they do, require less expensive treatment. One health insurance policy is offered, tailored to the average person’s health care needs: the premium is equal to the average person’s medical expenses (plus the insurer’s expenses and normal profit).
Explain why such an insurance policy is unlikely to be feasible.
In an effort to avoid the adverse selection death spiral, a private health insurer offers two health insurance policies: one that is intended for those who are more likely to require expensive treatment (and therefore charges a higher premium) and one that is intended for those who are less likely to require treatment (and therefore charges a lower premium).
Could this system overcome the problem created by adverse selection?
How do provincial and territorial governments in Canada, the U.S. Veterans Health Administration, and the British National Health Service (NHS) avoid these problems?