7.7 PROBLEMS
Question 7.15
To help fund airport security, Canada imposes the Air Travellers Security Charge (ATSC), an excise tax on the sale of domestic airline tickets. In 2011 the total excise tax was $14.96 per round-
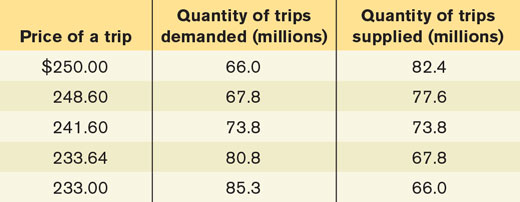
What is the revenue in 2011 from this excise tax?
Suppose that on January 1, 2017, the total excise tax increases to $17.00 per ticket. Assume the supply and demand schedules have not changed. What is the quantity of tickets transacted now? What is the average ticket price now? What will be the 2017 revenue of the ATSC?
Does this increase in the excise tax increase or decrease the revenue of the ATSC?
Question 7.16
The Canadian government would like to help the North American auto industry compete against overseas automakers that sell trucks in Canada. It can do this by imposing an excise tax on each foreign truck sold in Canada. The hypothetical pre-
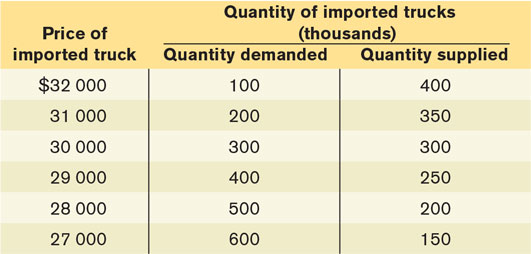
In the absence of government interference, what is the equilibrium price of an imported truck? The equilibrium quantity? Illustrate with a diagram.
Assume that the government imposes an excise tax of $3000 per imported truck. Illustrate the effect of this excise tax in your diagram from part (a). How many imported trucks are now purchased and at what price? How much does the foreign automaker receive per truck?
Calculate the government revenue raised by the excise tax in part (b). Illustrate it on your diagram.
How does the excise tax on imported trucks benefit North American automakers? Whom does it hurt? How does inefficiency arise from this government policy?
Question 7.17
Suppose, in order to raise additional revenue and hopefully make sales taxes more progressive, the federal government imposes a tax on sales of new luxury cars. For simplicity, assume that the tax is an excise tax of $6000 per car. The accompanying figure shows hypothetical demand and supply curves for luxury cars.
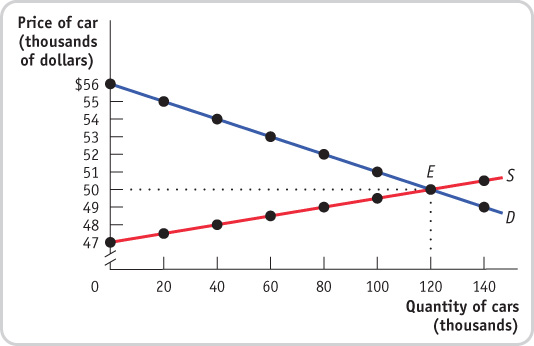
Under the tax, what is the price paid by consumers? What is the price received by producers? What is the government tax revenue from the excise tax?
Suppose a new prime minister is elected who promises to reduce the excise tax on luxury cars. As a result the excise tax falls from $6000 per car to $4500 per car.
After the reduction in the excise tax from $6000 to $4500 per car, what is the price paid by consumers? What is the price received by producers? What is tax revenue now?
Compare the tax revenue created by the taxes in parts (a) and (b). What accounts for the change in tax revenue from the reduction in the excise tax?
Question 7.18
All provinces impose excise taxes on gasoline. According to the Alberta Treasury Board and Finance, Alberta imposes an excise tax of $0.09 per litre of gasoline. In 2012, gasoline sales in Alberta totalled 6 billion litres. What was Alberta’s tax revenue from the gasoline excise tax? If Alberta doubled the excise tax, would tax revenue double? Why or why not?
Question 7.19
In Canada, each provincial and territorial government can impose its own excise tax on the sale of cigarettes. Suppose that in the province of Upper Canada, the provincial government imposes a tax of $2.00 per pack sold within the province. In contrast, the neighbouring province of Lower Canada imposes no excise tax on cigarettes. The pre-
Draw a diagram of the supply and demand curves for cigarettes in Upper Canada showing a situation in which it makes economic sense for a person to smuggle a pack of cigarettes from Lower Canada to Upper Canada. Explain your diagram.
Draw a corresponding diagram showing a situation in which it does not make economic sense for a person to smuggle a pack of cigarettes from Lower Canada to Upper Canada. Explain your diagram.
Suppose the demand for cigarettes in Upper Canada is perfectly inelastic. How high could the cost of smuggling a pack of cigarettes go until a person no longer found it profitable to smuggle?
Still assume that demand for cigarettes in Upper Canada is perfectly inelastic and that all smokers in Upper Canada are smuggling their cigarettes at a cost of $1.85 per pack, so no tax is paid. Is there any inefficiency in this situation? If so, how much per pack? Suppose chip-
embedded cigarette packaging makes it impossible to smuggle cigarettes across the provincial border. Is there any inefficiency in this situation? If so, how much per pack?
Question 7.20
In each of the following cases involving taxes, explain: (i) whether the incidence of the tax falls more heavily on consumers or producers, (ii) why government revenue raised from the tax is not a good indicator of the true cost of the tax, and (iii) how deadweight loss arises as a result of the tax.
The government imposes an excise tax on the sale of all university and college textbooks. Before the tax was imposed, 1 million textbooks were sold every year at a price of $50. After the tax is imposed, 600 000 books are sold yearly; students pay $55 per book, $30 of which publishers receive.
The government imposes an excise tax on the sale of all airline tickets. Before the tax was imposed, 3 million airline tickets were sold every year at a price of $500. After the tax is imposed, 1.5 million tickets are sold yearly; travellers pay $550 per ticket, $450 of which the airlines receive.
The government imposes an excise tax on the sale of all toothbrushes. Before the tax, 2 million toothbrushes were sold every year at a price of $1.50. After the tax is imposed, 800 000 toothbrushes are sold every year; consumers pay $2 per toothbrush, $1.25 of which producers receive.
Question 7.21
The accompanying diagram shows the market for cigarettes. The current equilibrium price per pack is $4, and every day 40 million packs of cigarettes are sold. In order to recover some of the health care costs associated with smoking, the government imposes a tax of $2 per pack. This will raise the equilibrium price to $5 per pack and reduce the equilibrium quantity to 30 million packs.
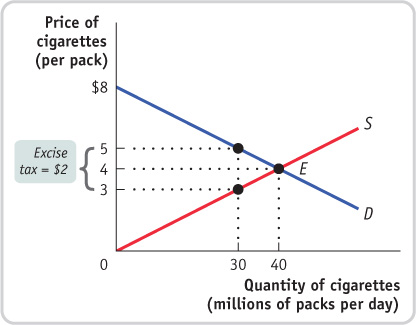
The economist working for the tobacco lobby claims that this tax will reduce consumer surplus for smokers by $40 million per day, since 40 million packs now cost $1 more per pack. The economist working for the lobby for sufferers of second-
Question 7.22
Consider the original market for pizza in Lafacville, illustrated in the accompanying table. Lafacville officials decide to impose an excise tax on pizza of $4 per pizza.
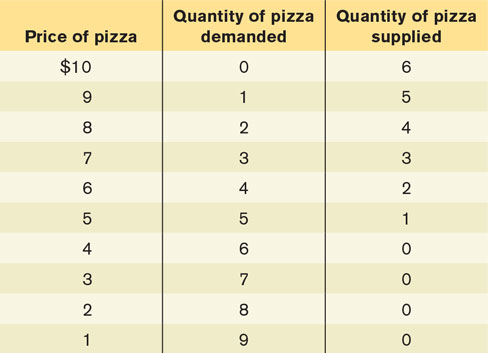
What is the quantity of pizza bought and sold after the imposition of the tax? What is the price paid by consumers? What is the price received by producers?
Calculate the consumer surplus and the producer surplus after the imposition of the tax. By how much has the imposition of the tax reduced consumer surplus? By how much has it reduced producer surplus?
How much tax revenue does Lafacville earn from this tax?
Calculate the deadweight loss from this tax.
Question 7.23
A province needs to raise money, and the finance minister has a choice of imposing an excise tax of the same amount on one of two previously untaxed goods: the province can tax sales of either restaurant meals or gasoline. Both the demand for and the supply of restaurant meals are more elastic than the demand for and the supply of gasoline. If the finance minister wants to minimize the deadweight loss caused by the tax, which good should be taxed? For each good, draw a diagram that illustrates the deadweight loss from taxation.
Question 7.24
Assume that the demand for gasoline is inelastic and supply is relatively elastic. The government imposes a sales tax on gasoline. The tax revenue is used to fund research into clean fuel alternatives to gasoline, which will improve the air we all breathe.
Who bears more of the burden of this tax, consumers or producers? Show in a diagram who bears how much of the excess burden.
Is this tax based on the benefits principle or the ability-
to- pay principle? Explain.
Question 7.25
Assess the following four tax policies in terms of the benefits principle versus the ability-
A tax on gasoline that finances maintenance of provincial roads
An 8% tax on imported goods valued in excess of $800 per household brought in on passenger flights
Airline-
flight landing fees that pay for air traffic control A reduction in the amount of income tax paid based on the number of dependent children in the household
Question 7.26
You are advising the government on how to pay for national defense. There are two proposals for a tax system to fund national defense. Under both proposals, the tax base is an individual’s income. Under proposal A, all citizens pay exactly the same lump-
Is the tax in proposal A progressive, proportional, or regressive? What about the tax in proposal B?
Is the tax in proposal A based on the ability-
to- pay principle or on the benefits principle? What about the tax in proposal B? In terms of efficiency, which tax is better? Explain.
Question 7.27
Each of the following tax proposals has income as the tax base. In each case, calculate the marginal tax rate for each level of income. Then calculate the percentage of income paid in taxes for an individual with a pre-
All income is taxed at 20%.
All income up to $10 000 is tax-
free. All income above $10 000 is taxed at a constant rate of 20%. All income between $0 and $10 000 is taxed at 10%. All income between $10 000 and $20 000 is taxed at 20%. All income higher than $20 000 is taxed at 30%.
Each individual who earns more than $10 000 pays a lump-
sum tax of $10 000. If the individual’s income is less than $10 000, that individual pays in taxes exactly what his or her income is. Of the four tax policies, which is likely to cause the worst incentive problems? Explain.
Question 7.28
In Transylvania the basic income tax system is fairly simple. The first 40 000 sylvers (the official currency of Transylvania) earned each year are free of income tax. Any additional income is taxed at a rate of 25%. In addition, every individual pays a social security tax, which is calculated as follows: all income up to 80 000 sylvers is taxed at an additional 20%, but there is no additional social security tax on income above 80 000 sylvers.
Calculate the marginal tax rates (including income tax and social security tax) for Transylvanians with the following levels of income: 20 000 sylvers, 40 000 sylvers, and 80 000 sylvers. (Hint: You can calculate the marginal tax rate as the percentage of an additional 1 sylver in income that is taxed away.)
Is the income tax in Transylvania progressive, regressive, or proportional? Is the social security tax progressive, regressive, or proportional?
Which income group’s incentives are most adversely affected by the combined income and social security tax systems?
Question 7.29
You work for the Saskatoba Treasury Board and Finance, providing economic advice to the finance minister. The premier wants to overhaul the personal income tax system and asks your advice. The current income tax system in Saskatoba consists of a proportional tax of 10% on all income. Suppose there is one person in the province who earns $110 million; everyone else earns less than $100 million. The premier proposes a tax cut targeted at the very rich so that the new tax system would consist of a proportional tax of 10% on all income up to $100 million and a marginal tax rate of 0% (no tax) on income above $100 million. You are asked to evaluate this tax proposal.
For incomes of $100 million or less, is this tax system progressive, regressive, or proportional? For incomes of more than $100 million? Explain.
Would this tax system create more or less tax revenue, other things equal? Is this tax system more or less efficient than the current tax system? Explain.
Question 7.30
Suppose the government decides to levy a small excise tax on consumers in a perfectly competitive market in which the elasticity of demand is greater than the elasticity of supply. Who will bear more of the tax burden: the suppliers or the consumers? Explain why.
Question 7.31
In extreme cases the supply or demand curve can be either vertical (perfectly inelastic) or horizontal (perfectly elastic). In such extreme situations the burden of a per-
A horizontal demand curve results in the suppliers bearing the entire burden of an excise tax.
A horizontal supply curve results in the consumers bearing the entire burden of an excise tax
A vertical demand curve results in the consumers bearing the entire burden of an excise tax.
A vertical supply curve results in the suppliers bearing the entire burden of an excise tax.
A vertical supply or demand curve results no deadweight loss when an excise tax is imposed.
Question 7.32
This question uses the algebraic method to solve problems from Appendix 3A and Appendix 6A. Suppose that the demand and supply for maple syrup are given by the following equations:
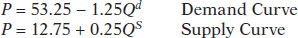
where Q is the quantity in millions of litres and P is the price per litre. The federal government is considering imposing an excise tax equal to $1.50 a litre.
Determine the price and quantity in the initial equilibrium where no tax is charged.
Solve for the new equilibrium quantity, the price paid by consumers, the price received by producers (excluding the tax), the tax revenue collected, and the buyer’s and seller’s shares of the tax burden.
How do your answers to parts (a) and (b) change after the income of consumers rises, shifting the demand curve to P = 55.50 − 1.25Qd?
How do your answers to parts (a) and (b) change if instead an improvement in technology shifts the supply curve to P = 7.50 + 0.25QS?
How do your answers to parts (a) and (b) change if instead an improvement in technology shifts the supply curve to P = 11.25 + 0.15QS? (Hint: Round your price and quantity figures to 2 decimal places.)
Question 7.33
This question uses the algebraic method to solve problems from Appendix 3A and Appendix 6A. Suppose the monthly demand and supply for iPods are given by the following equations:
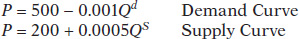
Use the demand and supply curves to solve for the equilibrium price and quantity. Create a diagram to depict this equilibrium.
Suppose the government is considering introducing a tax on electronics that would add $50 to the cost of an iPod. Solve for the new equilibrium quantity, the price paid by consumers, the price received by producers (excluding the tax), the tax revenue collected, and the buyer’s and seller’s shares of the tax burden.
How did the consumer surplus, producer surplus, and total economic surplus change?
What is the deadweight loss created by the tax? How much comes from consumers? How much from producers?