EXERCISE 8.3
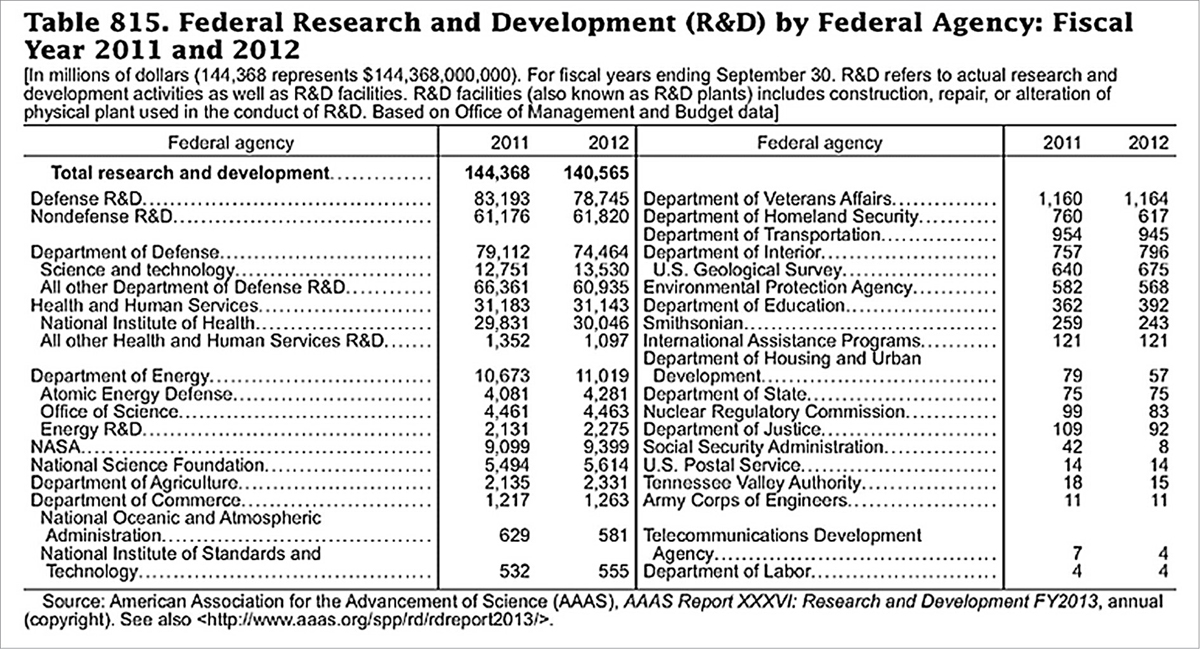
3. The following table provides statistics on federal research and development expenditures (U.S. Census Bureau, 2013, Table 815). Study the table, and then perform the following tasks:
Create two different graphics, each of which compares federal R&D funding in 2011 and 2012.
Create two different graphics, each of which compares defense and nondefense R&D funding in either 2011 or 2012.