TECH TIP: How To Create a Gantt Chart
307
If you want to show how activities occur over time, you can create a simple Gantt chart using the Table feature in Word.
1. Create a table with enough cells to include your tasks and dates.
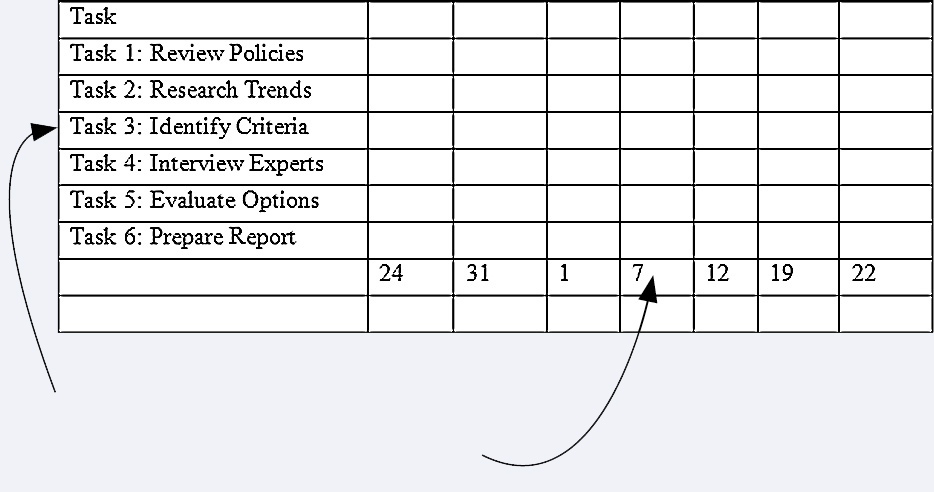
Enter the tasks in rows.
Enter the dates in columns.
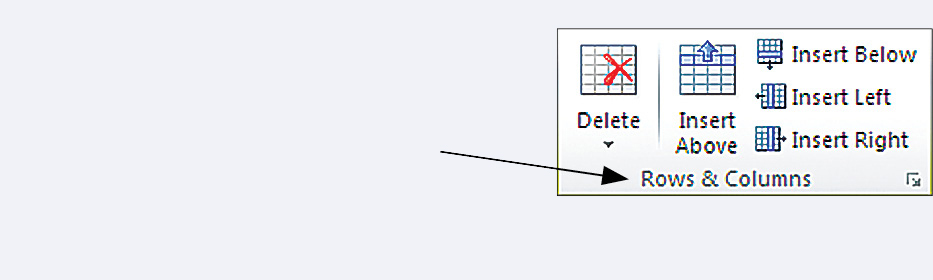
If you need to add or remove rows or columns, you can use the buttons in the Rows & Columns group on the Table Tools Layout tab.
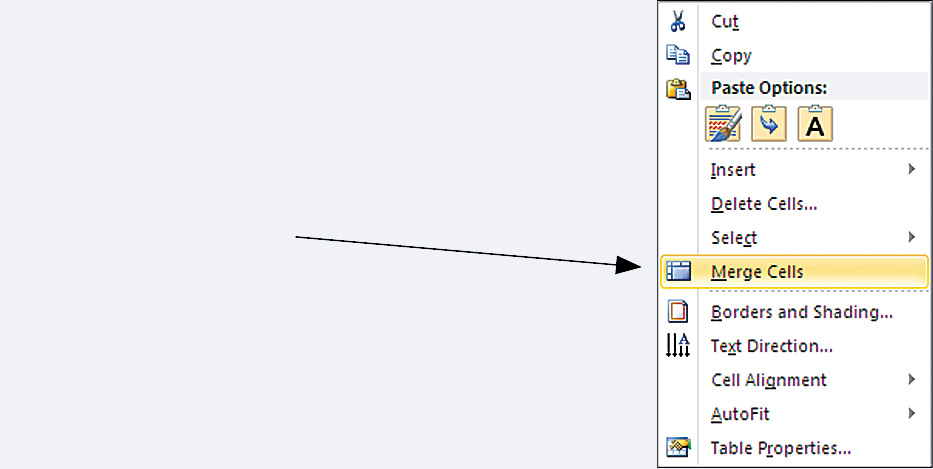
2. To create cells that span several columns, select the cells you wish to merge, right-click, and then select Merge Cells on the pop-up menu.
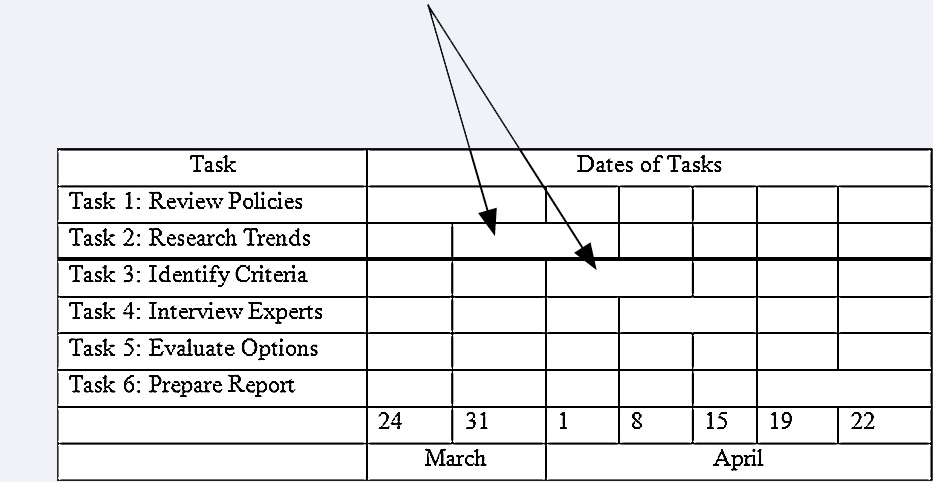
To create column headings, first merge the cells that will contain the column heading. Then type in your heading in the expanded cell. To add a horizontal rule below the heading, select the cell that contains it and choose Borders and Shading from the Format tab.
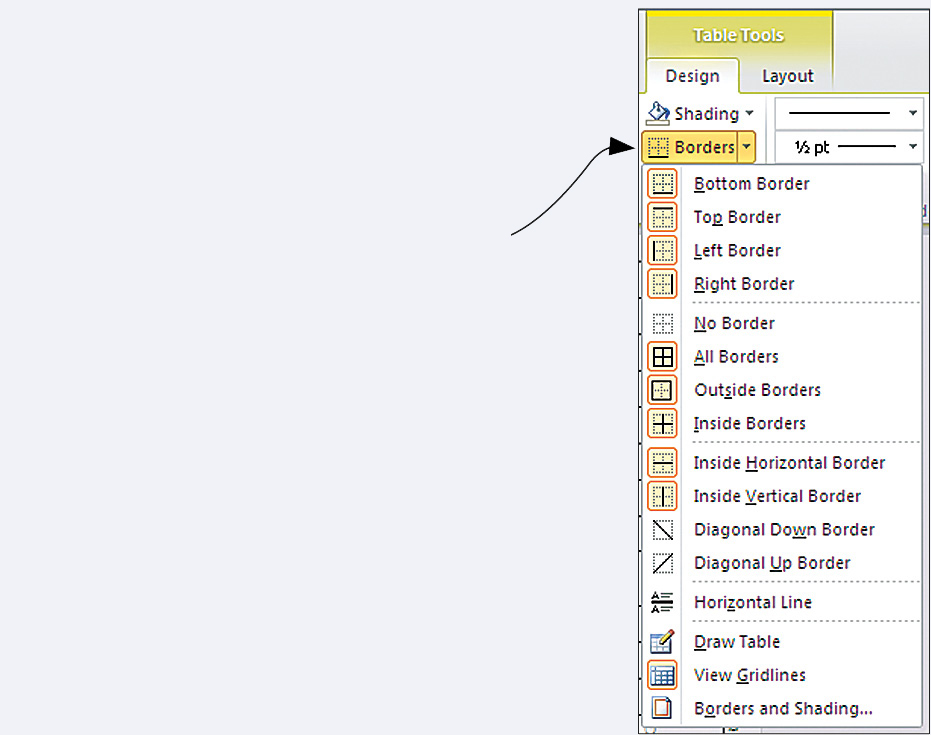
3. To differentiate completed tasks (dark bars) from tasks yet to be completed (lighter bars) or to hide borders, select the cells you wish to modify and then choose the Borders button on the Table Tools Design tab. Then select Borders and Shading.
The Borders and Shading dialog box will appear.
The Borders tab allows you to hide borders of selected cells. The Shading tab allows you to shade selected cells.
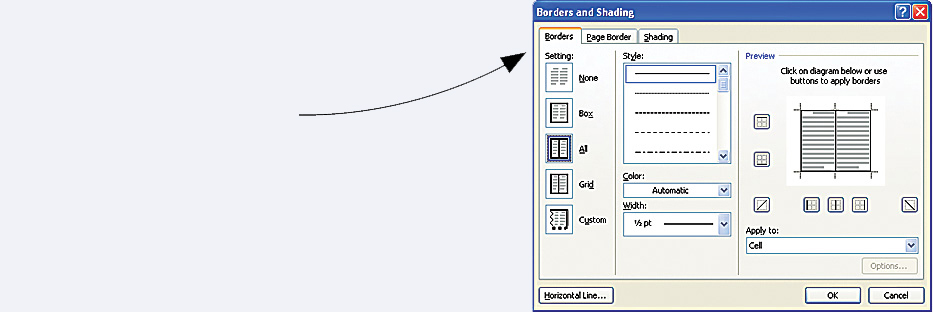
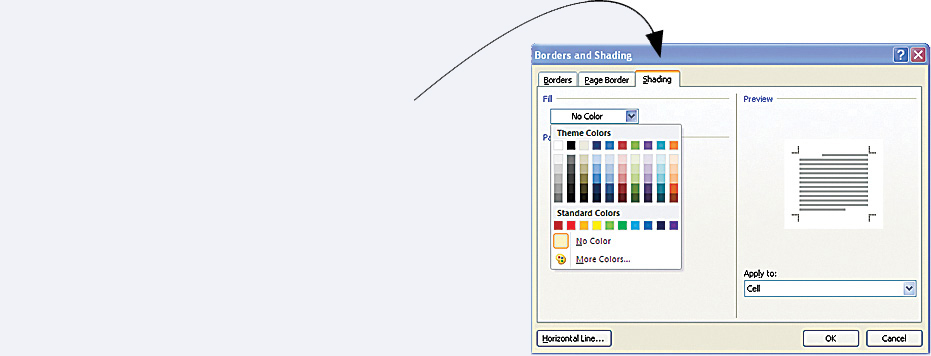
The Shading tab allows you to shade selected cells.
KEYWORDS: table, cells, merge cells, borders, shading