Chapter 1. Experiment 11a
Qualitative Inorganic Analysis Preview
Purpose of the Experiment
Separate and identify representative cations from each of three traditional inorganic qualitative analysis groups. Determine the presence or absence of each cation in unknown mixtures.
Background Information
An important aspect of chemistry is the analysis of substances for their chemical composition. If you want to know WHAT is present in a substance, this is qualitative analysis. However, if you want to know HOW MUCH of a substance is present in a compound, this is quantitative analysis. In the next set of experiments, you will be performing qualitative inorganic analysis on groups of metal cations. There are five groups of cations in the traditional inorganic qualitative analysis scheme. The cations are grouped together on the basis of a common characteristic solubility. In the traditional qualitative analysis scheme, each of the groups is successively separated from a mixture and then analyzed to determine individual composition. However, you will analyze Group 1 and 2 together and then Group 3. Only a few representative cations of each group will be analyzed. Each group’s background and procedure will be discussed separately.
In These Experiments
For each group, you will first run through the procedure with a solution of known composition. In the following experiment, you will repeat the procedure with an unknown solution. By comparing the observations of the known and unknown solutions, you will determine which cations are present and write a rationale. A rationale is a logical discussion outlining the reasons why you think certain cations are present and others are absent.
Background Vocabulary
A solid compound that forms as a result of mixing reagents together in a solution is a precipitate. The liquid above the solid in a mixture of solid and solution is the supernate. To physically separate the precipitate from the supernate, you would centrifuge (spin rapidly) the sample to compact the solid. After centrifuging, the liquid is very carefully poured into a new test tube, leaving the compacted solid behind in the original test tube. To decant a liquid is to carefully pour the supernate off a solid. The liquid that was poured off or decanted into a separate container is the decantate.
Background Techniques
1. Mixing Solutions or Mixtures: Stir the mixture with a clean glass stirring rod. Stir in an up-and-down circular pattern. This will efficiently mix solids and solution together. Never mix by holding your thumb over the top of the test tube and inverting or shaking.
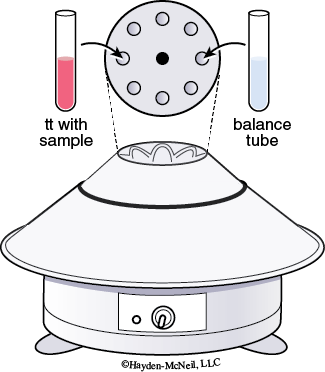
2. Centrifuging Mixtures: Place your test tube containing your test solution in a metal sleeve in the centrifuge. Next place a second test tube with approximately the same volume in the sleeve directly opposite your test tube. Note which sleeve has your test tube. Spin the sample for 1–2 minutes. You must always balance the centrifuge!
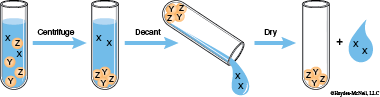
3. Decanting Mixtures: Centrifuge the sample, then very carefully pour the liquid into a new test tube, leaving the compacted solid behind in the original test tube.
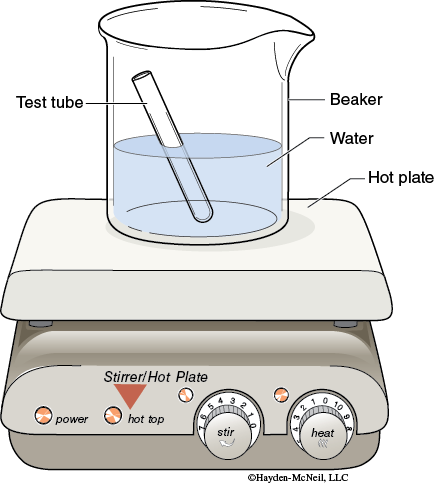
4. Heating a Solution: Place a 250 mL beaker about half filled with distilled water on hot plate. Heat the beaker using a setting of about 7 to maintain a constant low boil. Use a test tube clamp to hold the test tube in the hot water bath.
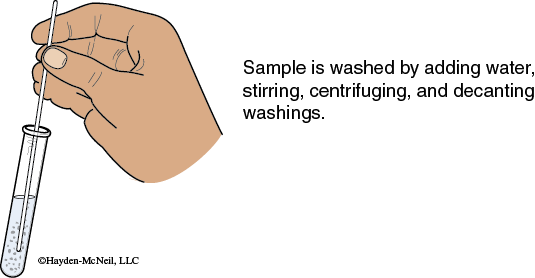
5. Washing a Precipitate: Add a small amount of the specified solution to the solid and mix with a stirring rod. Centrifuge the sample and decant the supernate. Generally the decantate is discarded, but check your specific instructions. This procedure literally washes the old solution or contaminants off the surface of the solid.
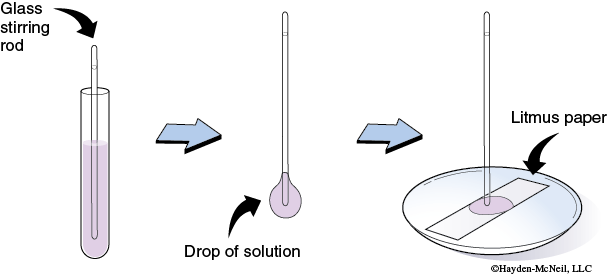
6. Testing pH: Place a piece of litmus paper on a clean, dry, watch glass. Dip a clean glass-stirring rod into the solution to be tested. Touch the end of the stirring rod to the litmus paper. Never dip the paper into the solution to be tested! A solution is acidic if it turns blue litmus paper red. A solution is basic if it turns red litmus paper blue.
In These Experiments - Continued
Recording of Data
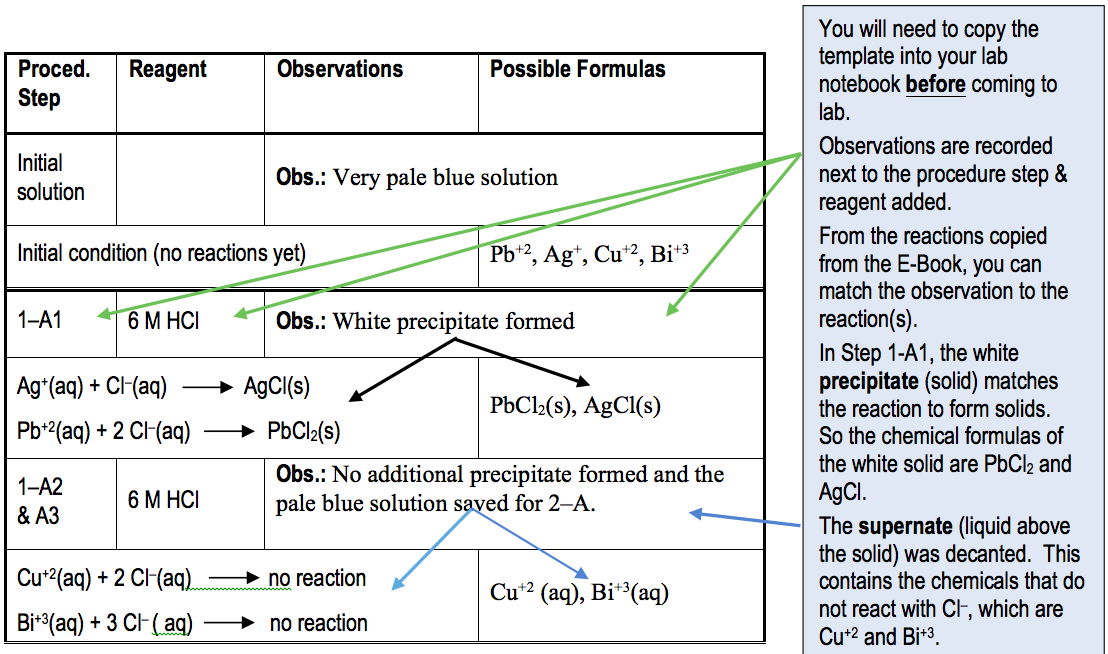
In these experiments, your observations will be recorded in a different format, as shown in a sample data page shown below. This table is designed to record the Procedure step, Reagent added, Observation, Chemical Reaction that occurs, and Formulas of the chemical species present in the test tube. Note that the Formulas are simply the products of the reaction, or if no reaction occurred, the cations as reactants. Being able to record the observations and having the chemical reaction below it, allows you to connect the chemistry to what you observe in the test tube.
In the Sample Data Page, some observations are shown. In Step 1-A1, when 6 M HCl was added, a white precipitate formed with a light blue supernate. From the reactions copied from the E-Book, it shows that Ag+ and Pb+2 react with Cl– to form precipitates (solid). Thus, the two products of those reactions, AgCl(s) and PbCl2(s), will go in the Possible Formulas column adjacent to the Chemical Reaction and under the observation of the solid. Likewise, the light blue solution that was poured off this white solid (decantate), did not react with the HCl. Note that Cu+2 and Bi+3 do not reaction and thus their chemical formulas remain the same. You will turn in this Data Page at the end of lab.
Before coming to lab, you MUST create your Data page, setting up the columns and copying the reactions. This will allow you to easily fill in the observations as you proceed through the experiment. See the template posted in the E-Book. You will turn in this data page at the end of the lab. The flowchart and rationales will be submitted as your Data Analysis.
Sample Data Page
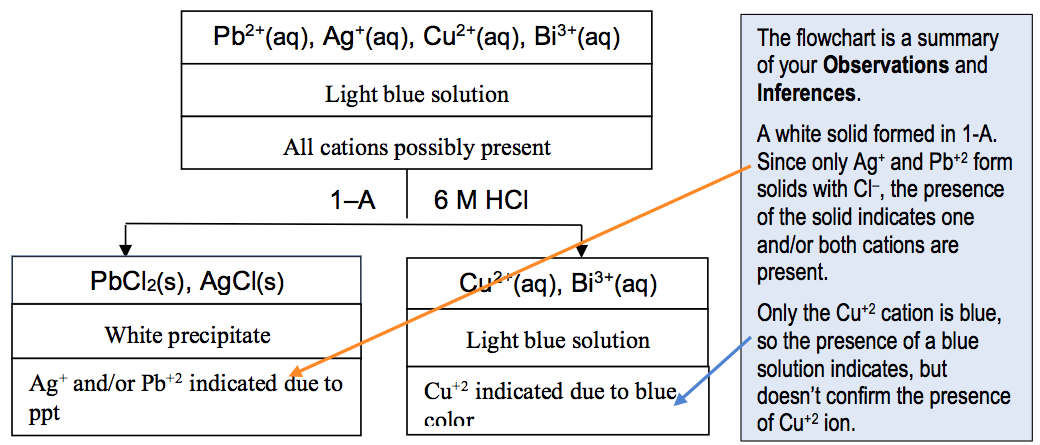
For Data Analysis, to be turned in at the next lab, you will summarize your data in a graphical form of a flowchart and a rationale. A flowchart template for the known solution is given with each group. You will need to copy the known flowchart into your notebook and add your observations and the inferences to the chart. The Inferences are the conclusions you can make from your observations. Essentially the Inferences in the flowchart provide the “outline” for a Rationale. The Rationale is the written discussion of the logic used to prove that a cation is present. It explains step wise how the observations prove the presence (or absence) of a cation. It is NOT just the results of the confirmation step. The rationale will include each inference that include that cation.
Flowchart Example
Rationale Example
Ag+ is present because a white precipitate formed when HCl was added in step 1–A, and only Ag+ and Pb2+ form insoluble salts. Then the white precipitate did NOT dissolve in hot water. Only PbCl2, not AgCl, dissolves in hot water. The presence of Ag+ was confirmed by the white precipitate dissolving in NH3, step 1–D and then reprecipitating in step 1–E. Only the AgCl salt will dissolve in NH3 and precipitate again, when the solution is acidified.
The information about the solubility of the compounds, what cations will form solids and what cations will stay in solution, is all given in the Group Background section of the experiment in the E-Book.. You must READ and APPLY the information given in the Background section.
Unknowns – In Exp. 12 & 14, you will repeat the procedures of Exp. 11 & 13, but the initial solution will be an unknown solution. The unknown solution will have 1 or more of the cations that were found in the known solution. For the unknown solution, you will need to modify the flowchart, since some steps may be omitted.
For example, if a solid did NOT appear in 1–A1, then you would know that Group 1 cations, Ag+ and Pb2+ ions were ABSENT. This would lead you to write a different conclusion in the Inference box of the flow chart. Also since you do not have a solid to use in Step 1-B, you would not be able to do step 1-B, 1-C, 1-D, and 1-E.
Activity Completed!