Chapter 1. Experiment 18
Rates of Reaction
Purpose of the Experiment
To observe a reaction performed at varying concentrations to determine the rates of reaction and the rate constant expression (Rate Law).
Background Required
This experiment will use basic laboratory techniques, volume measurements techniques and time measurements. The concepts dilution calculations, rates of reactions, reaction orders, and rate constant expression are used in this experiment.
Background Information
Kinetics is the study of how fast reactions occur. Rate for the appearance of a product is defined as the change in concentration of A per change in time, Δ[A]/∆time. The rate of appearance of an aqueous product generally has units of M/sec. From the gas laws, we know that the number of moles is directly proportional to Pressure. So the rate of appearance of the gas phase product can also be measured in terms of pressure/sec, specifically in today’s experiment in kPa/sec.
Most reactions occur in multiple steps that added together yield the overall reaction. Each step occurs at its own rate. However, the overall reaction rate is dependent on the rate of the slowest step. This slowest step is also known as the rate determining step. The mathematical expression of showing how the rate depends on the reactants in the rate-determining step is called the Rate Law or Rate constant expression. The rate constant expression has a generalized expression shown below, where k is the rate constant, A and B are the reactants, and m and n are the reaction orders.
Rate = k [A]m[B]n
The reaction orders are the exponents to which the concentrations of the reactants are raised. Typically the orders are whole numbers. The reaction orders must be determined experimentally; they are NOT the stoichiometry coefficients from the balanced equation.
In This Experiment
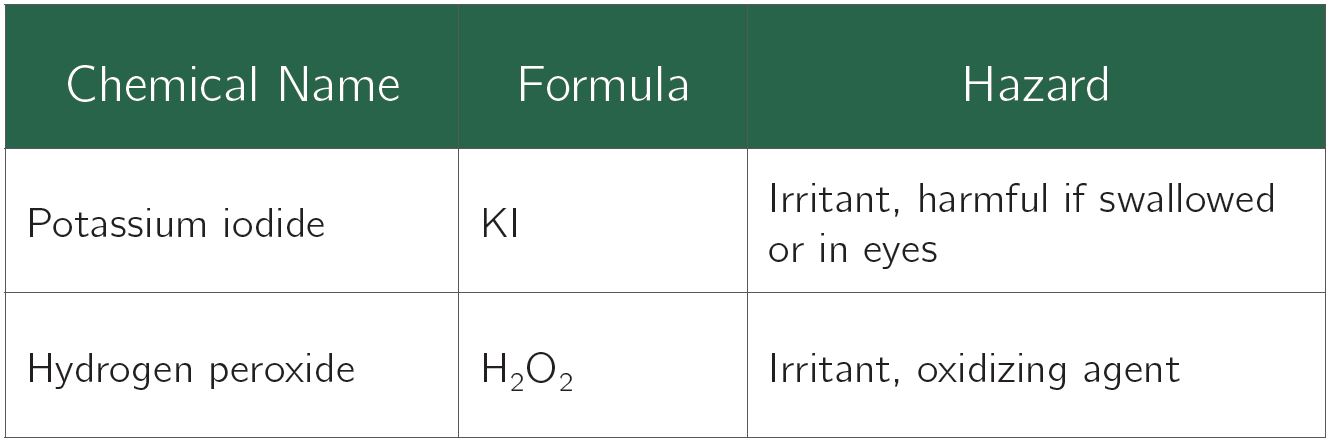
As it was observed back in Exp. 7, H2O2 decomposes to produce O2(g) and water. In that experiment, you used yeast to catalyze (speed up) this reaction and measured the volume of O2(g) produced. However, in this experiment, you will use KI to catalyze the reaction and determine the rate of appearance of O2(g) by measuring the increase of pressure due to the production of O2(g).
During the reaction, the rate of O2 production varies. Initially, the rate is constant, but as the H2O2 is used up, the rate slows down. The slope (Δpressure/Δtime) during the initial time segment is the initial reaction rate (kPa/sec).
The reaction is thought to occur by the mechanism below.
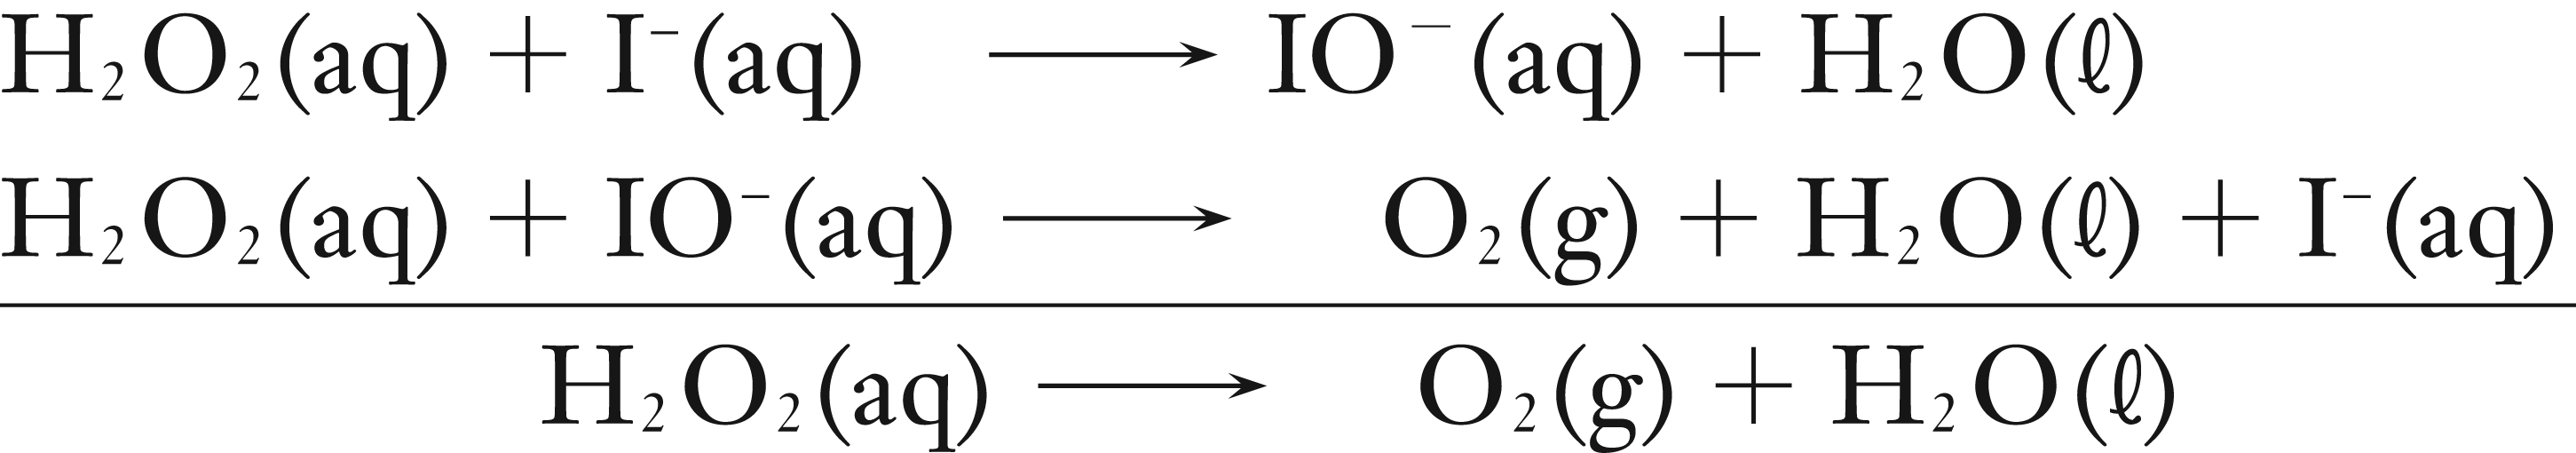
If we assume that the first step is the rate determining step, then the rate constant expression will be written as below.
Rate = k [H2O2]m[I–]n
You will vary the concentration of H2O2 (holding the concentration of I– constant) to determine the order of m. Next you will vary the concentration of I– (holding the concentration of H2O2 constant) to determine the order of n. Then you will determine the average value of k, the rate constant, and determine the specific rate constant expression.
Example
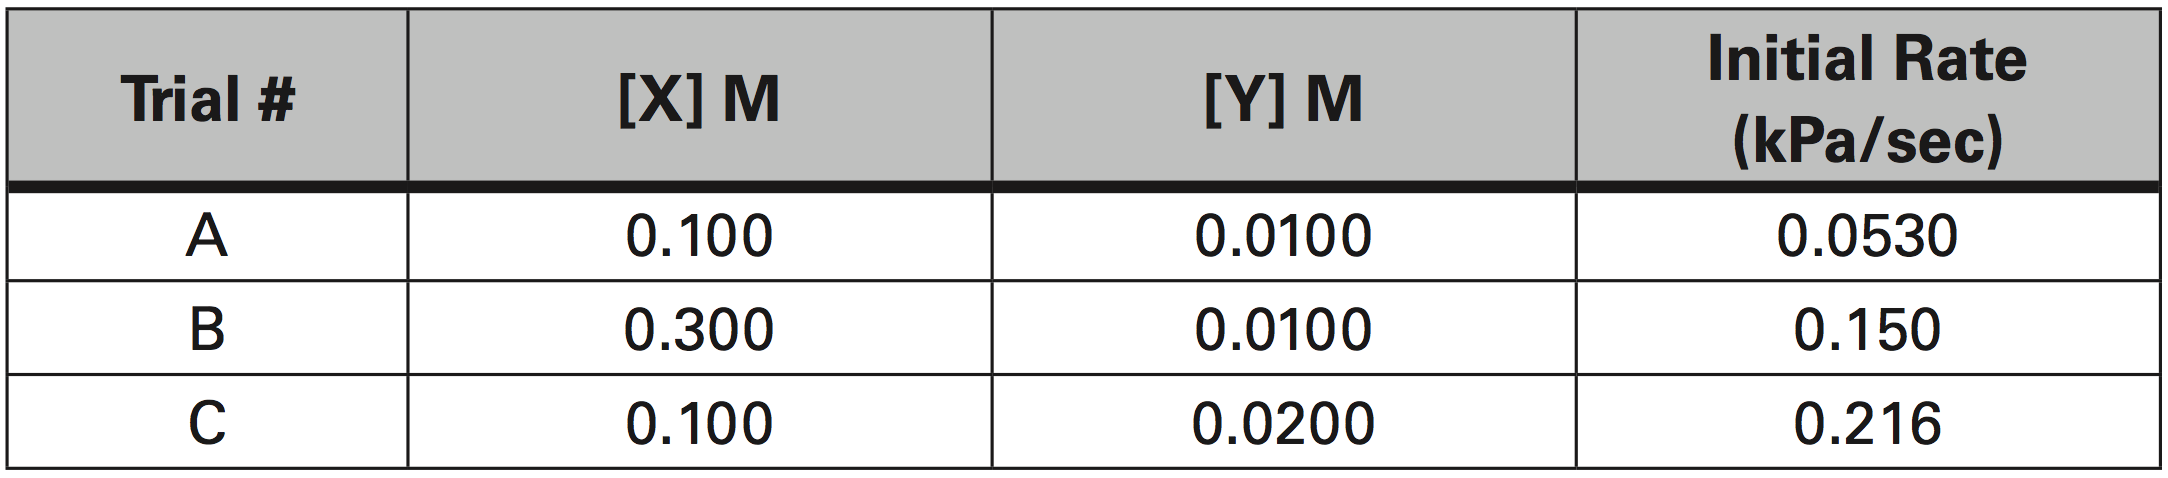
The rate of appearance of Z is measured by the increase in Pressure due to the production of Z. The initial rate of reaction was measured as the slope from the graph of Pressure (kPa) vs time (sec). Given the experimental data in the table below, determine the individual orders of reaction, the average value of k, and the rate constant expression (Rate Law).
2 X(aq) + Y(aq) → Z(g)
Rate constant expression: Rate = k [X]m [Y]n
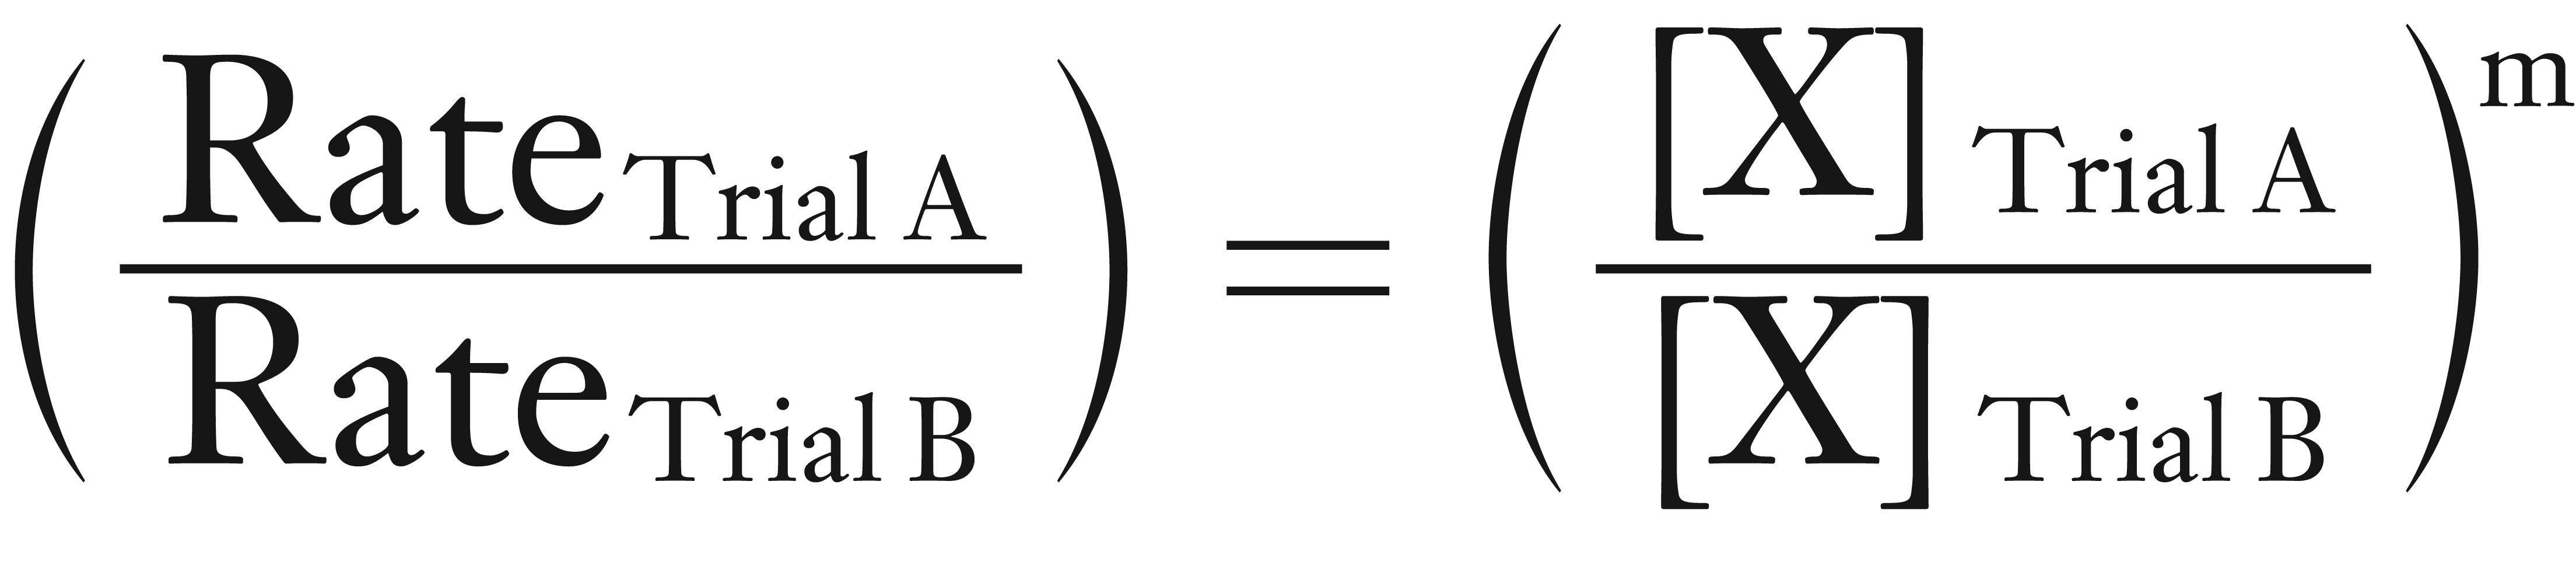
a. What is the order of reaction for X?
To determine the order for X, you must identify two trials where X concentration varied and the Y concentration stayed the same.
Trials B and A fit this criteria.
Mathematically, we can determine the order by the equation shown below.
In many of the calculations in textbooks and homework, the rate values have been modified so that the (ratio of the rates) is a whole number.
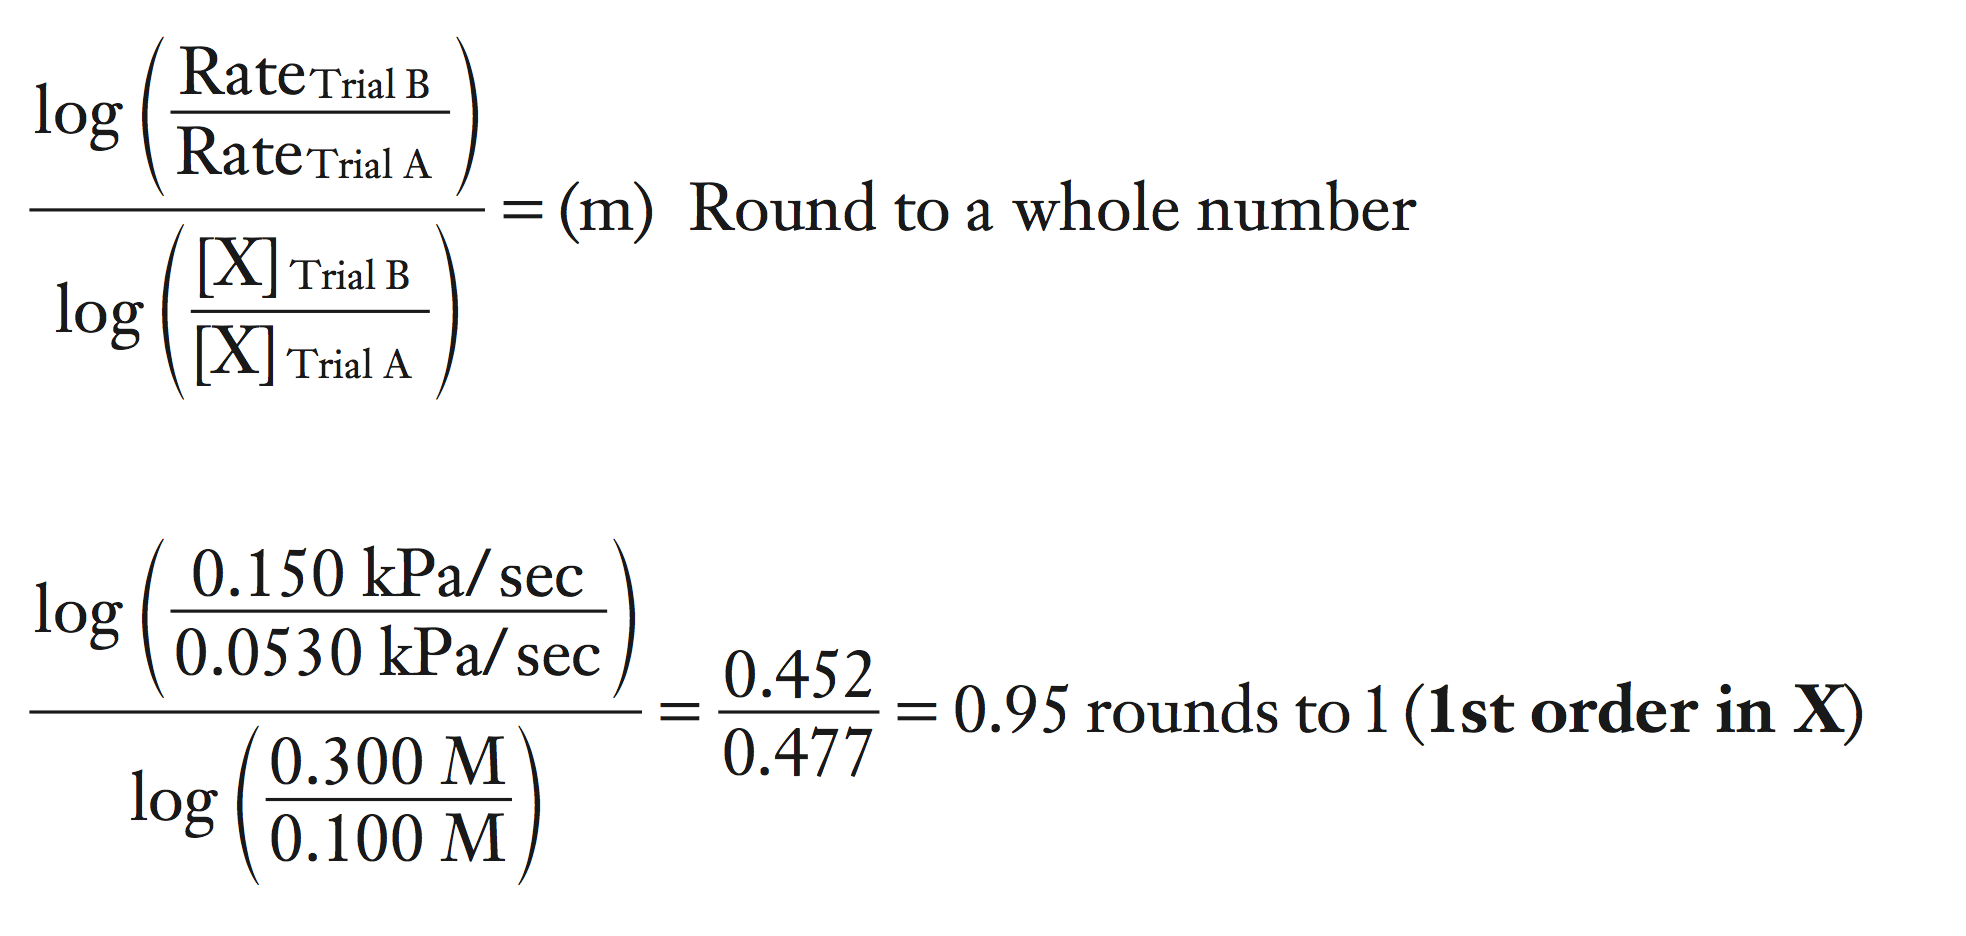
However, in the real world, the (ratio of the rates) is rarely a whole number. To make the determination easier, we take the log of both sides.
log (ratio of the rates) = log (ratio of the concentrations) × m
Now solve for m by dividing both sides by the log (ratio of the concentrations).
log (ratio of the rates) / log (ratio of the concentrations) = m
To make the calculations easier, always place the larger concentration of X on top in the calculations.
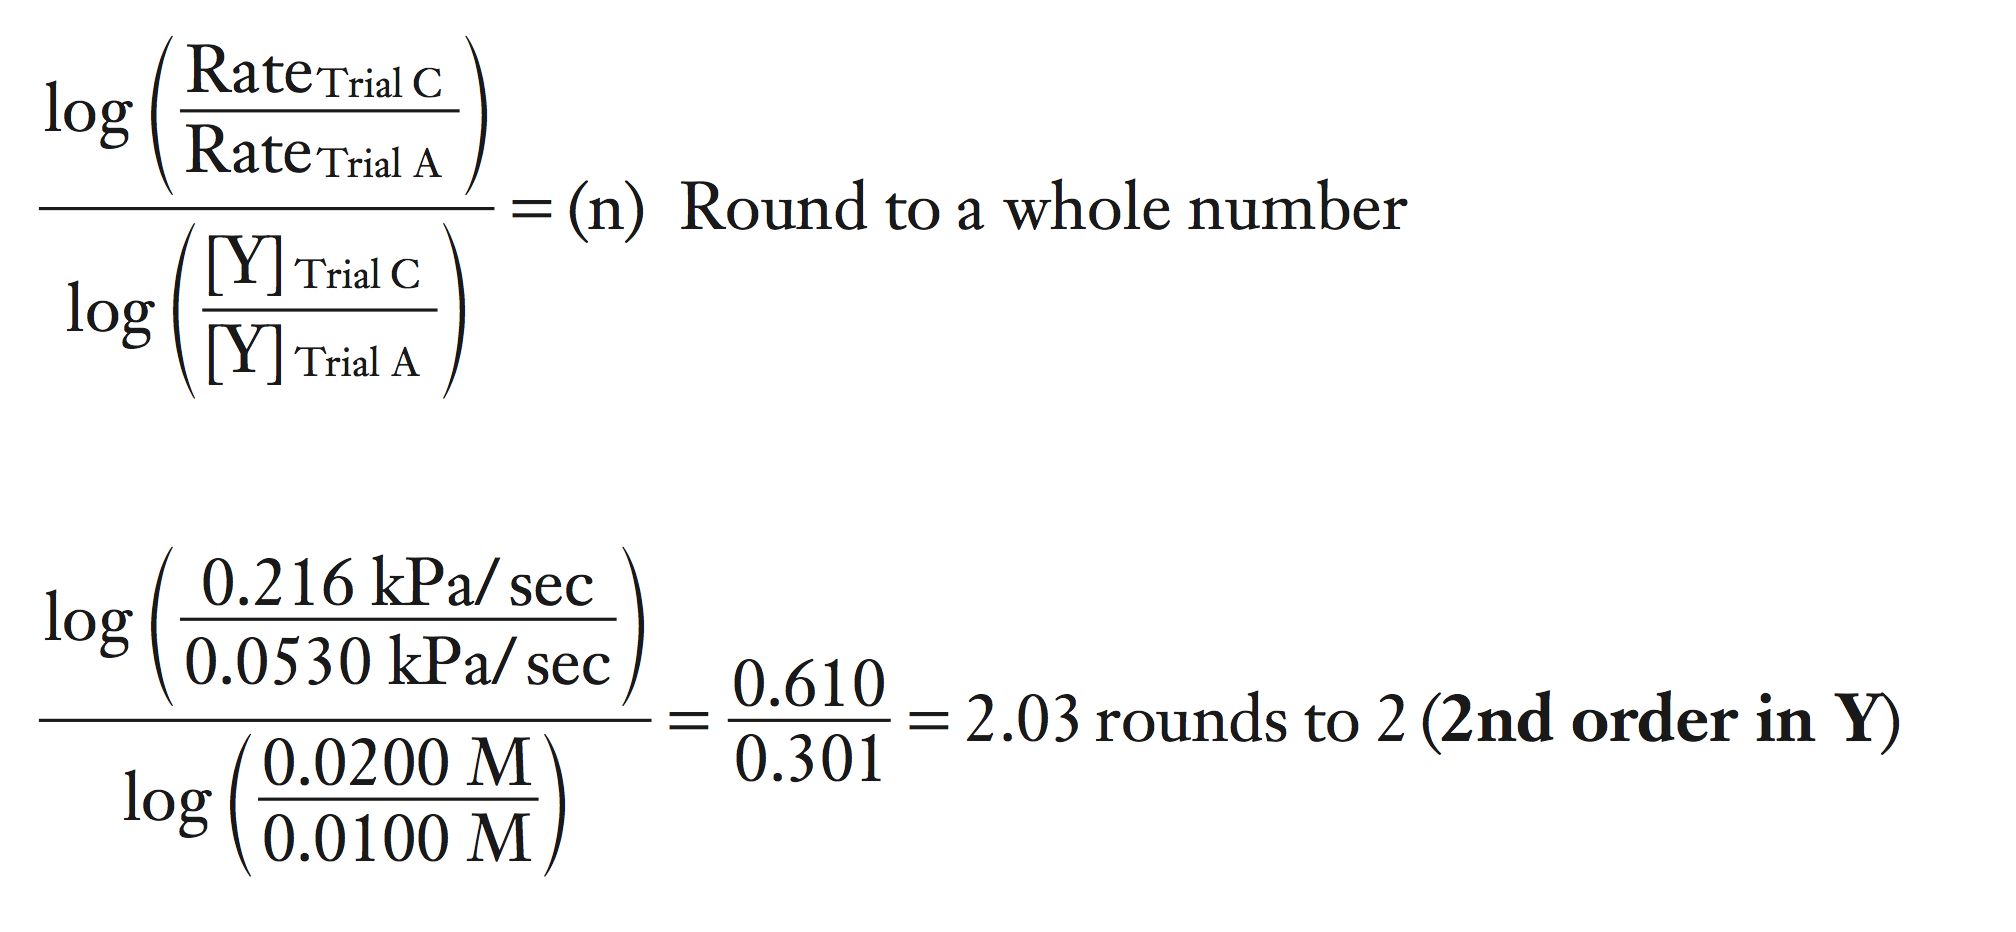
b. What is the order of reaction for Y?
To determine the order for Y, you must identify two trials where Y concentration varied and the X concentration stayed the same.
Trials C and A fit this criteria.
Place the larger concentration on top.
c. What is the average value of the rate constant, k?
To find the value of k, rearrange the rate constant expression (also known as Rate Law) to solve for k. Then substitute the value of the Rate and concentrations of X and Y and the orders of X and Y for each trial.
Rate = k [X]1 [Y]2
k = Rate / {[X]1 [Y]2}
Trial A: k = (0.0530 kPa/sec) / {(0.100 M)(0.0100 M)2} = 5300 kPa/(sec·M3)
Trial B: k = (0.150 kPa/sec) / {(0.300 M)(0.0100 M)2} = 5000 kPa/(sec·M3)
Trial C: k = (0.216 kPa/sec) / {(0.100 M)(0.0200 M)2} = 5400 kPa/(sec·M3)
Now average the three values of k.
kave = (5300 + 5000 + 5400) / 3 = 5233 rounds to 5230 kPa/(sec·M3)
the units of k can also be written as: kPa sec–1· M–3
k = 5230 kPa/(sec·M3) or k = (5230 kPa sec–1·M–3)
d. What is the rate constant expression or Rate Law?
Substitute the orders and the average value of k into the rate constant expression (also known as the Rate Law).
Rate Law:
Rate = (5230 kPa sec–1M–3) [X]1 [Y]2
(If a number is not given as an order of reaction, it is assumed that it is 1.)
Rate = (5230 kPa sec–1M–3) [X] [Y]2
Procedure
Always Wear Safety Goggles and Use Good Lab Practices
Chemical Alert:
Part I
Setup and Trial A
1. Obtain ~50 mL of 0.88 M (3%) H2O2 in a 50 mL beaker and a 10 mL graduated, plastic syringe and label both.
Obtain ~30 mL of 0.5 M KI in a separate 50 mL beaker and a 5 mL graduated, plastic syringe and label both.
2. Obtain a LabQuest, temperature probe, and gas pressure sensor. Connect the temperature probe to the LabQuest. See Figure 10-1 (Exp. 10) on how to set up the glassware & sensors for a gas pressure expirement.
3. Connect the plastic tubing from the gas pressure sensor to the rubber stopper assembly. Twist the fittings only about a 1/2 turn to get a good seal.
Don’t over turn! The valve connected to the stopper must be in the closed position.
4. Using the stylus, tap the MODE box on the LabQuest. On the MODE SCREEN, keep the mode as time based and adjust the time length to 480 seconds. Click OK.
5. Measure out 45 mL of deionized water and pour into a 125 mL Erlenmeyer flask. Using a H2O2 syringe, add exactly 10 mL of 0.88 M H2O2 to the flask. Refer to Exp. 2 figures on how to read and use a syringe.
Place a small magnet into the flask and place on the magnetic stirrer/hot plate. Adjust the speed of the stirring to achieve a good mixing, but no vortexes. (No eyes of a hurricane!) Use this same stirring speed throughout the experiment.
6. Place the temperature probe into the H2O2 solution. When the temperature readings remain constant, record the temperature of the solution. Disconnect the temperature probe. Connect the gas pressure sensor. If needed, refer to Figure 10-1.
7. Using the KI syringe, add 5 mL of the KI solution to the Erlenmeyer flask. Quickly and firmly seal the flask with the stopper and tap PLAY to begin data collection.
8. Monitor the pressure during the reaction. If the pressure exceeds 130 kPa, carefully remove the stopper from the Erlenmeyer flask and stop the data collection.
9. At the end of 8 minutes, tap STOP and remove the stopper from the flask. Pour the solution down the drain with plenty of water.
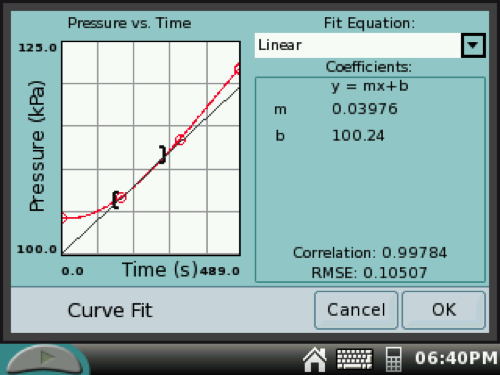
10. On the GRAPH SCREEN, drag the stylus over a linear 60-second increment near the beginning of the reaction. (This highlights the selected data.)
Tap Analyze at the top of the screen and then select Curve Fit. Tap the check box for Pressure and select Linear. Record the slope of the line as the initial rate of reaction (kPa/sec).
If you want to select a different increment to determine the slope, tap CANCEL. Back on the GRAPH SCREEN, drag the stylus over a different increment and repeat Analysis steps.
11. Repeat steps 5, 7–10 for a second trial A. Discard previous data.
Part II
Trial B
12. Measure out 50 mL of deionized water and pour into a 125 mL Erlenmeyer flask. Using a H2O2 syringe, add exactly 5 mL of 0.88 M H2O2 to the flask. As in step 5, add the small magnet into the flask and place on the magnetic stirrer/hot plate. Use the same stirring setting as in Trial A.
13. Using the KI syringe, add 5 mL of the KI solution to the Erlenmeyer flask. Quickly seal the flask with the stopper and tap PLAY to begin data collection. (Discard previous data.)
14. At the end of 5 minutes, tap STOP and remove the stopper from the flask.
Pour the solution down the drain with plenty of water.
15. Repeat step 10, using the stylus to highlight the linear 60-second increment near the beginning of the reaction. Record the slope of the line as the initial rate of reaction (kPa/sec).
16. Repeat steps 12–15 for a second trial B.
Part III
Trial C
17. Measure out 47.5 mL of deionized water and pour into a 125 mL Erlenmeyer flask. Using a H2O2 syringe, add exactly 10 mL of 0.88 M H2O2 to the flask. As in step 5, add the small magnet into the flask and place on the magnetic stirrer/hot plate. Use the same stirring setting as in Trials A & B.
18. Using the KI syringe, add 2.5 mL of the KI solution to the Erlenmeyer flask. Quickly seal the flask with the stopper and tap PLAY to begin data collection. (Discard previous data.)
19. At the end of 8 minutes, tap STOP and remove the stopper from the flask.
Pour the solution down the drain with plenty of water.
20. Repeat step 10, using the stylus to highlight the linear 60-second increment near the beginning of the reaction. Record the slope of the line as the initial rate of reaction (kPa/sec).
21. Repeat steps 17–20 for a second Trial C.
22. All solutions can be poured down the drain with lots of running water. Return the LabQuest and probes. Return the magnet to the dispensing table.
Data Analysis
Calculations & Determination
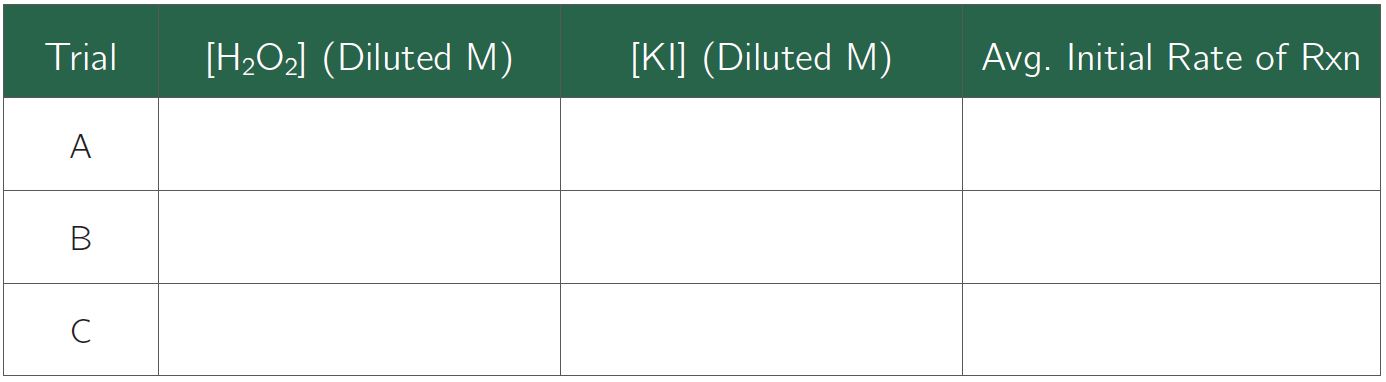
Calculate the diluted M of H2O2 and KI in each reaction mixture for Trials A, B, and C. (The final volume is the total volume of all chemicals.)
Fill in Table 18-1.
Average the initial rate of reactions for each set of Trials. Fill in Table 18-1.
Determine the orders of reaction for H2O2 and KI. (Round to whole numbers.)
Calculate the value of k, the rate constant, for Trial A, B, and C using the average initial rate of reactions. Average the values of k.
Write the rate constant expression (Rate Law) inserting the value of k and the individual orders of H2O2 and I–.
Discussion
1. Summarize the results of this experiment.
2. What is the quality of the results?
3. What were the errors or possible errors in the experiment?
4. How would the errors affect the results of the experiment?
Study Questions
1. Define rate constant expression, reaction order, rate constant, and initial rate of reaction.
2. A reaction mixture was formed by adding 50 mL of water, 10 mL of 0.88 M H2O2, and 10 mL of 0.5 M KI.
a. What is the molarity of the H2O2 in the solution?
b. What is the molarity of the KI in the solution?
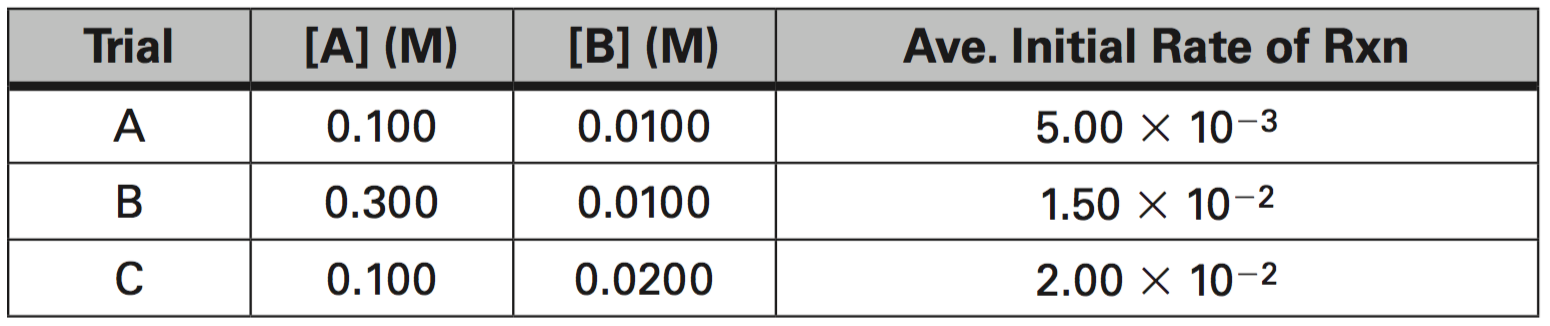
3. Given the data in the table below, determine the following:
a. What is the order of reaction for A?
b. What is the order of reaction for B?
c. What is the average value of the rate constant, k?
d. What is the rate constant expression or Rate Law?
4. For each trial, you did duplicate runs. How do the values of the initial rate of reaction compare? What does this indicate about the reproducibility of your results?
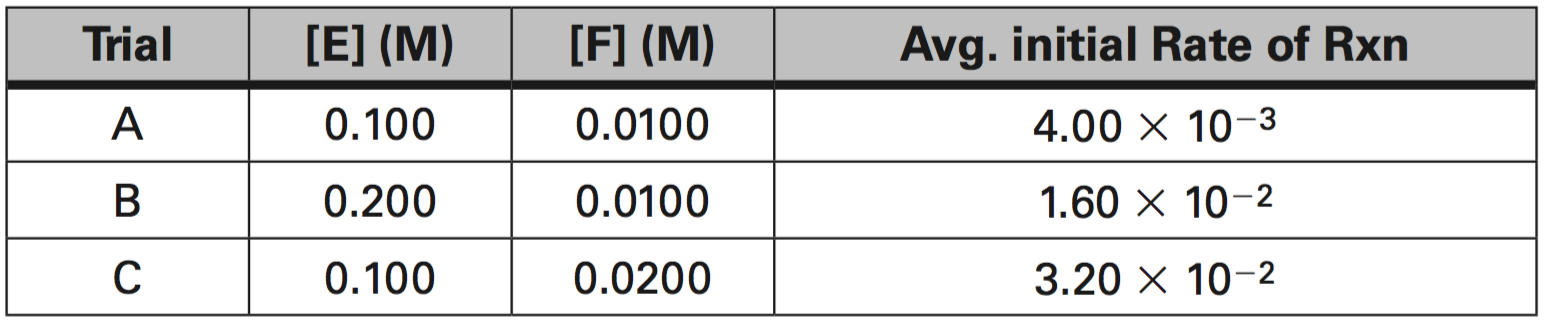
5. For the Data Set below, determine the following:
a. What is the order of reaction with respect to E?
b. What is the order of reaction with respect to F?
c. What is the average value of the rate constant, k?
d. What is the rate constant expression or Rate Law?
Activity Completed!