Chapter 17. The Hertzsprung-Russell Diagram
17.1 Introduction

Author: Scott Miller, Penn State University
Editor: Grace L. Deming, University of Maryland
The goals of this module: After completing this exercise, you should be able to:
- Explain how astronomers can determine the luminosities and temperature of stars.
- Describe how astronomers use these properties to determine trends among stellar groups.
- Explain how the sizes of stars can be determined once their luminosities and temperatures are determined.
In this module you will explore:
- How distance affects the apparent brightness of a star based on the inverse square law describing the behavior of light.
- How the surface temperature of a star affects its absorption spectrum.
- How astronomers use stellar spectra to indicate a star's temperature.
- How a plot of stellar properties allows astronomers to categorize stars.
Why you are doing it: The Hertzsprung-Russell diagram ("H-R diagram") is one of the greatest tools that astronomers have at their disposal. While at face value it simply looks like a plot of one stellar property as a function of another, in reality it is so much more. Almost all of a star's characteristics can be determined based on its placement on an H-R diagram. Astronomers not only learned of the various types of stars that exist based on their location on an H-R diagram, but can also learn about how a star changes over time, as its stellar properties change with age. The H-R diagram provides a wealth of information to astronomers.
17.2 Background
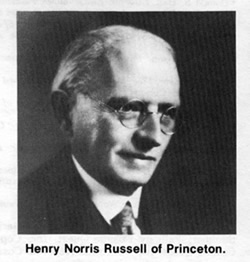
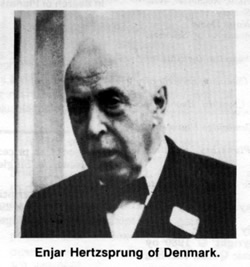
By the early 1900's, astronomers had determined the luminosities and temperatures of a large number of stars. Given that both of these are intrinsic properties of stars (they do not depend on the location of the observer and they are not affected by the motion of the star), astronomers were curious to find if there was any relationship between the two. In order to further investigate this relationship, two astronomers, Ejnar Hertzsprung and Henry Norris Russell, independently created a graph that plots these two properties. Today we call this graph the Hertzsprung-Russell diagram (or simply H-R diagram), in honor of the two astronomers.
The H-R diagram is an essential tool in astronomy. Not only does it display a relation between two intrinsic properties of stars, but as we will find out, it reveals a third one as well (relating the sizes of stars to luminosity and temperature). Other stellar properties can also be plotted on an H-R diagram, such as mass, stellar lifetime, and age. (Unfortunately, though, we do not have the time to cover all of these in one activity!) Astronomers can also use H-R diagrams to plot the evolution of a star from birth until death, and see how its properties change over its life.
17.3 Star Light, Star Bright
A star shines because fusion is taking place in its core, generating energy in the process. That energy makes its way through the star, out through its surface and into space. A measurement of the amount of energy a star gives off over time is known as its luminosity. Knowing the luminosity of a star allows us to determine how much energy the star generates. But how can we determine the luminosity of a star?
When we observe stars in the sky, they appear dim to us because they are so far away. What we measure is their apparent brightness; how bright they appear to us here on Earth. The apparent brightness of a star depends on how far away it is from us – the farther away the star is, the dimmer it will appear.
There exists a relationship between the apparent brightness of a star and its luminosity; the more luminous the star, the brighter it will appear. There is also a relationship between the apparent brightness of a star and its distance. Watch the following animation to discover this relationship.

As light leaves the star, it spreads out through space. If we follow one patch of light, we see that it will pass through one square region of space at a distance of one pc away from the star.
Question 17.1
fBwiKmLPhJut6olgGZb3OCw48baQ/HZoOo/AjiyjBefy9p+Ct5NxNKczQAPHZFF/gFhSEY9RD4BWOkHgRby4FEgpY0Dix5bDe1R3gdc66U1jRvQ78V2fFzEJa+GsZv68mnfGma6qW/B5bbljDqR/XgCZ0vK+L9e30tDVvmpIJ1dXjrBNX33wp0IUJ5Hxn3Hv/BSRe00mI1xr+Xt7y9cNwZQVuobtt2N717.4 The Inverse Square Law of Light
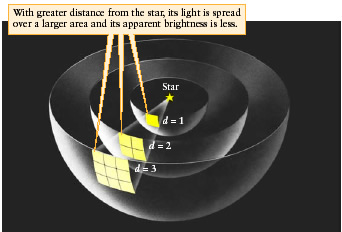
If you kept watching the previous animation, you saw that at a distance of 3 parsecs from the star, the same patch of light passed through nine square regions of space or, in other words, each square received one-ninth as much light. This relationship between apparent brightness and distance is known as the Inverse Square Law of Light. The apparent brightness of light depends on the inverse square of the observer's distance from the light.
We can write this as a formula: b = L/4πd2. Using this formula, if we can determine the distance (d) to a star and measure how bright it appears to us (b) on Earth, we can calculate its luminosity (L), an intrinsic property of a star.
Question 17.2
ihcw9FET6fIgSobHTHpU7ifScTYV1E2QPuQCcW0Fre1kSRZAhsZnKrjI7NnbiFu3Y/6hlGLLhOqTebocsgQvhBbhnTQhH7HlAWz2niZBGMVbRXXuMYUXQo9uSrY4HTyzqQffx4WXHTMR3So5UVG28V3zeOz6v3OGzsuuhaaf2Ag5Xvg9HipPLqrbKoV6NHEzcRT+47PeoO0QaOhvEidcN2GlAP2XA5qxy4BY8GGXZ0SDRmZaFwB3TG/uwSj3LTGxKFx/FzQp2u6NROEDjMdfFOBDx7C/lw6Swb4gerZQdyT+kIKR7xSM8wd3xC6ZGkG1eIwJwdbLXQ66FCwRtBYpckJfYsPx6CgGFsaA8QIVpXcjBZvmDbuy+o0XMWYEwIzhd2Ld0X8GOEX052jZKxb33IycqpHe7vNcZcxO/2zKSufsjbNgzuEikXBAvQ9aycQP6S59oQr5KvCkSycEIAg9rbkozW4PN15x8hXfUI1OoREPrBb+17.5 Apparent Magnitudes
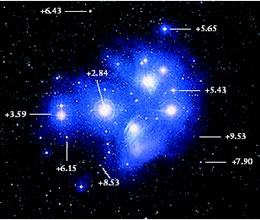
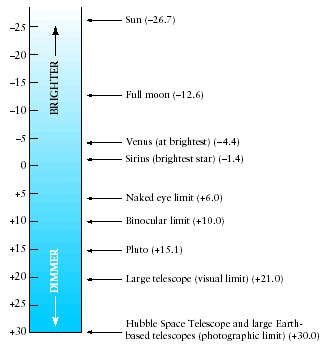
Astronomers use a different system of measurement to note the luminosities of stars. In ancient times, a Greek astronomer named Hipparchus observed the stars that he could see with the unaided eye and decided to rank them based on their apparent brightness. He ranked the brightest stars he could see as first class stars, and the dimmest stars he could see as sixth class stars. Since then, modern astronomers have reclassified Hipparchus' system into what is now known as the magnitude system. The apparent magnitude (m) of a star is a measurement of how bright it appears to observers on Earth. According to this system, brighter stars have lower magnitudes (numerically). It also turns out that a difference of five magnitudes corresponds to a ratio of 100 in brightness (it has to do with how our eyes measure a change in brightness).
Question 17.3
MQsUv5qitMgGLyc0cGBjhNzzMZFn0gzxUe54eKbRMeavJzz30k8BmxpsahqRa66+2EkW1WQqlpk7//bYAS0H524BXdD2XABUttBXJdA/I3NBLFNuPtD1ey5Xv+6Vy4LTa5PFzBRutOhiQLfb5i0kjMep5ahinnjEiRI9ybhiWXN2kRgwGtyNntQdwK/W1TApgewO/4wslOGigBehBajQ28EljdxHMQy+NvtdF6s4NlijMdOH17.6 Absolute Magnitudes
Apparent magnitude is analogous to apparent brightness. The equivalent measure of a star's luminosity is called its absolute magnitude. Absolute magnitude (M) is an intrinsic measurement of a star's luminosity in terms of magnitudes. Because absolute magnitude does not change, astronomers needed to determine how to set this value. By definition, the absolute magnitude of a star is equal to its apparent magnitude if it were located at a distance of 10 parsecs (pc) from the observer. We can write this as a formula:
m - M = 5 log d - 5
For a star exactly at 10 pc, log (10) = 1, so m - M = 5(1) - 5 = 0. At this distance, the apparent magnitude is exactly equal to the absolute magnitude.
Question 17.4
O7xw2kYpbq77sxHcIxzKLc7CIprkUdqOUwg67OMZykcsULY2Nd8akSY9cxZW1vsMYFcmQ3dLZn4xhr0Fw+ASYhaCYkj+0fBJDWpiEdwr2eaoBYA+36zy93R5AN+/NqsHa0Pf58XX4ePFZZZciubI7VYvszw+PxCLWS/pblBUfgEux34f+JqVjLqSOMOPNYF+s+ERgfXbdzpgAajgsH9+g6HX/mGgpB2+u1h1g9VNMkSQCIoylsO4O5V2PmP70fhx+YcbEKOTfGQ=Incorrect. You can approach this two ways: 1) What is the log of 100? That is, how many times do you multiply ten by itself to get 100? Plug this into the formula and calculate the answer. 2) If you move a star farther away, does it appear brighter or dimmer? What does this do to the apparent magnitude of a star?
Summary
The Sun has an absolute magnitude of +4.8 (approximately +5), so astronomers can relate luminosity to absolute magnitude as follows:
| The Relationship Between Luminosity and Absolute Magnitude | |
|---|---|
| Luminosity (L\(\odot\)) | Absolute Magnitude |
| 10000 | -5 |
| 100 | 0 |
| 1 | +5 |
| 0.01 | 10 |
| 0.0001 | 15 |
17.7 Revisiting Wien's Law
Another property of stars which astronomers can determine is their surface temperature. According to Wien's law, a star's temperature is inversely related to the wavelength at which it emits most of its light. Therefore, if you can determine the wavelength at which a star emits most of its light, then you can determine its temperature.
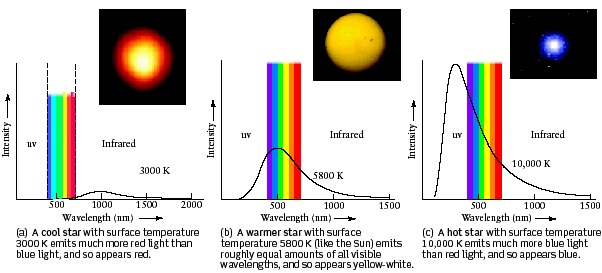
Rather than measure individual wavelengths of light from stars, astronomers will measure a range of wavelengths at the same time. In order to do so, they use filters to block out a portion of visible light; allowing only a subset of the visible spectrum through the telescope. In astronomy, there are three basic filters: U - ultraviolet, B - blue , V - visible (green/yellow). By comparing the relative intensities of light obtained through the various filters, astronomers can fit a blackbody curve to the data and use it to determine the temperature of the star. Examples of blackbody curves are shown in the figure above.
In order to see how filters can be used to reveal temperatures, watch the animation.
Question 17.5
oam68Ql2D6WQ6DHQiXFLeYrOHxQSgKYbBPvayezVt9QOv+O0PFUG7U21lVJGOjpuWRlnKWnQizydMKaawZFApZt2/ytmgxNLPD+T8ZzXI8R4hmb5hkrA5q87cMVg5xBCEcBKEXDOJivcbZIeKFVbGXLPWqA07dwwa8J4c6Pkv9hAjCTPKXnkyBG/J9gAUE7Xs8SE+WhnZafH48GnItPtTm0yMRPlcUUVdkZLS8n1V2T5V5vO/JkBZYjv5uyCESr5/c2NHNxTZ9E9F7PSC/WzZ5gqJlWy+/LuMVOjPGp9GoWy3efHmZkLgYuZZZmg69hh88+/9GF3RWq8y/En78dOXnUrLAghwottwRRezF/+NHcvzzNMhFsP714EBf57Y1Gs+cqWwOs5VLAWpyfeMVmK01Fb6aPJSdHwQmO0b1nLrNQ8faorbn/mMg==17.8 Stellar Spectra - Another Temperature Indicator
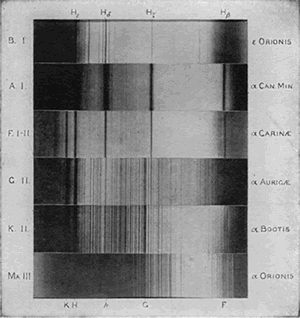
Astronomers have found another way to determine the temperatures of stars. Look at the spectra of a sample number of stars shown above. You may recall that stars have absorption spectra, the dark lines indicating the presence of various elements in the atmospheres of the stars. Notice that different stars have different spectra. Does this mean that they have different compositions? No. All stars are composed mostly of hydrogen, with some helium, and trace amounts of metals (elements other than hydrogen and helium). If all stars have roughly the same composition, then why do their spectra look different?
Recall that absorption spectra are created as low-density gases absorb their “favorite” wavelengths, allowing the rest to pass through. These wavelengths correspond to energies that will allow electrons to jump up to higher energy levels as they orbit the nuclei of atoms. The reason why stars have different spectra is because they span a variety of temperatures. Even though they are composed of the same atoms, the electrons are found at higher energy levels in stars with greater temperatures. Therefore, the same atoms absorb different energies depending on the temperature of the stellar atmosphere. For example, in cool stars, the electrons in hydrogen atoms are found mostly in the ground state. At this level, the electrons will only absorb infrared radiation; they will not absorb visible light. Therefore, in cool stars, we do not see the presence of hydrogen in their spectra. Similarly, in hot stars, the hydrogen has been ionized, and so the electrons will not absorb visible light as well.
Question 17.6
h275B2jivf23iwHpsJxCph9ZEqtsHkliMjtK+c6vJV6QZz2YYnDq4rIbE12GyeVph30zWlUapsrEVVRgEQDiYmK9RKN3gGzyAA3Z2JXq2Ef/EsffS7VRQBTgP5njReCJcoX/fuyg/zMM6H9jKWNEUw073Vkgi1eQbLRL4Cu6l2WcDbU+DyuFCOgYMSyfkIFz/zqQ0w1A1q/HBtp4pGY0iY5smIfc7pTPB99+fKvT6G3HSZnoRAieHBHze7/JjI1pWCoCR7BlwNC/e4O8df8Izcr+AEARRTR6XKoXm+doVItKLhScZeLjljExlU3+Mw/suXqr2PHfLOxmSP5WDfuna+wBBzZAf5hr0PZwXdnmACUQNhyxERA4YiX4UnOglHd9Hyu+yaBenGdSqrS7eHIyQ2p1UAwmMUM2x0yejUaJN/H+DzxhWW0xZw==17.9 Spectral Classification
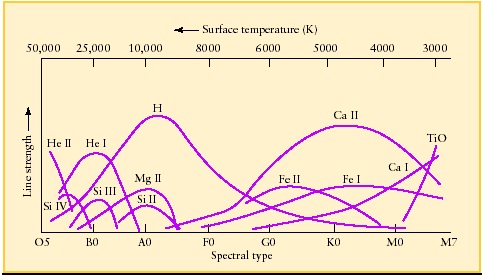
Originally, stars were classified by the strength of their hydrogen lines; A stars having the strongest hydrogen lines down to O stars, which had no hydrogen lines. Annie Jump Cannon (shown on the right), a noted astronomer who studied thousands of stellar spectra, realized that it made more sense to organize stars based on their temperature (an intrinsic property of stars), and so merged and reorganized the categories into the spectral classification scheme we use today. We now classify stars based on their temperature into one of seven spectral classes: O B A F G K M. O stars are the hottest stars while M stars are the coolest. You will notice that A stars, those with the strongest hydrogen lines, are found in the middle. Astronomers further classify stars with 10 subclasses in each class. For example, our Sun is a G2 star.
Question 17.7
Y786EvoaNEJYN9IYaeC8X7lvaeWC9oHW+G1ncALL2sD+xn9EMfr2gXifK15I0kxA3ko8RO7LgHVhVPramQIYtzvJStmps7d/tdBAmmE70R/n4cVzSnzIqWXAMFcJB775iFVTBg2eAPm5gdoNh7DwCHA3eOOc5pI/61DRoHKcuNuqPD8nEUC0Gd7+n6FQ9xAkUw+rWZqIulRmWOtW17.10 Looking for Trends Among Stellar Properties
Now that we know how to determine a few intrinsic properties of stars, we can plot them on a diagram to see if there is any pattern to their distribution. As discussed in the introduction, this is exactly what Hertzsprung and Russell did, creating the Hertzsprung-Russell diagram (H-R diagram).
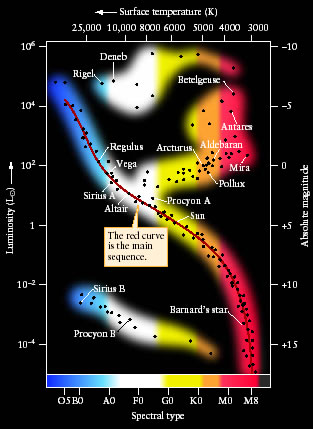
An H-R diagram is plotted as a function of two stellar properties: luminosity and spectral type. Spectral Type is plotted on the x-axis, with O stars on the left and M stars on the right. The hottest stars are located on the left side of the diagram, while cooler stars are located on the right side of the diagram. Since spectral class is directly related to temperature, we can also plot the x-axis as a function of temperature (indicated on the top axis of this H-R diagram).
Luminosity is plotted on the y-axis, with the most luminous stars at the top. Stars not producing as much energy are located further down the y-axis. Since luminosity is independent of distance, we can also plot the y-axis as a function of absolute magnitude (how bright a star appears from the standard distance of 10 parsecs) which appears on the right side this H-R diagram.
Take a look at the H-R diagram on the right. Are the stars evenly distributed across the diagram? No, they are not. Looking at the diagram, you'll notice that most stars fall along a roughly diagonal line which we call the Main Sequence.
Question 17.8
HhfI/iRWxGAMBwxWDeIvFmXeVw6Vy0tSkXK/nNrDzkhkMHNxUSkqOLf8QAKA80qeaUqddijHBxeAVhJDZyD4CoO9aSbB0Y20wtyZBiEiZSwBlX5+GG0FgyQFUeyEdQisVHzzfhfDzs3BxlS73aXWJ5nSJVsSVvLyazYGcz35hX9z6rs+NIbZLttMtwXhuAPqbDRBho0irOYuUq7GcImW5iV+GBuyUUrf8lCljLXwDzovN5UBuGQqXBxTM5HaE8lkFb6JJuGS5S24MzsdzN2NSKsQ/xYjTssy1TZWrCVFQkqQXbMz1BcbClSQr7pvLkvY5ZpzGQPiv/IqRixfLMljDSz8MEAMRlRrt21VfSRl07oCtG70RQpN2UtZxg4xHClMsHptdl3/2geAT212Sgci/1yKKT/dk3FonvLyfjWemTdLeJgKYxeuUSoKj8WNCyRTHfukDPcpurMyTxt7uUqhII+Ha15TTQtceupjYYmxD/fqWUAgWq2G7/lcj42PKJCow7s0tjhIsvA=17.11 Determining the Sizes of Stars
It turns out that if you know the luminosity and temperature of a star, you can also determine its radius. Here's how:
The luminosity (L) of a star is the amount of energy that passes through its surface every second. This is the same as saying that the luminosity of a star is equal to the intensity (I) of energy which passes through a unit surface area of the star every second times the star's surface area (A). We can write this as a formula:
L = IA
According to the Stefan-Boltzmann law, the intensity of light is related to its temperature (T):
I = σT4
The surface area of a sphere is given by:
A = 4πR2 (where R is the star's radius)
We can therefore rewrite the equation for luminosity as:
L = 4πR2σT4
Astronomers simplify this equation by using solar units (L\(\odot\) , R\(\odot\) , T\(\odot\) ). Doing so, the equation can be written as:
L = R2T4
This is known as the Luminosity-Radius-Temperature Relation. As you can see, if you know two of the quantities (such as luminosity and temperature) you can determine the third (radius). Using this relation, astronomers can determine the radii of stars.
Question 17.9
Vwn2Prkg36zV3qJSu5fcEWGUWgKc/9NxVuqLdr1ghdM16glokjV3ocCqp4i+ObBc4rJN1H3yu+oQoG/GnmWjYnb3iDz7ifCw11tlGgxVqoT3rKWx6HkXhsgeTnXNLQG0H6i3wkhVMwDHvkLTOuB2HQyibFlZLjJOgAxO1kkJBSWU2KN2PdLbEGPwgfbmSoUZ1UCAYPLcmospdZkwvg5cZCPvRaugoA2NQt5wllgAm0Wk+1kRpXSjJctgZ5hApflkv+asFWX22uJcjCgWON32sw6nSag0taav8H+oDiuDnD1ofMXboYuxlZ7CQEj+F87YmHflGdlOcV54F/ba+qPNYfsog5SAcUhfxbG9Sp4/qOAW54a/jDePh2df1IIhcKLZHoamSrawOvIavCV269jJWZ8IpwlRKwoxK0GO4XlHfNz22eDSSoSaVuNCbWc=17.12 A Variety of Stars
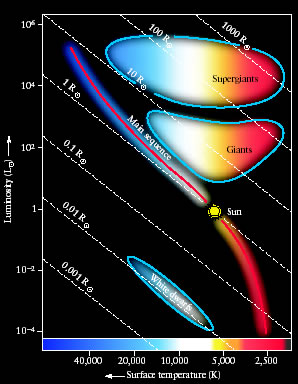
Since radius can be determined once you know the luminosity and temperature of a star, we can plot this information on an H-R diagram as well. Look at the figure above. The dashed lines represent lines of constant radius; all stars on the same line are the same size.
Question 17.10
mGwzPMZhQJX6tqL66B+Y0QZt1Ii62rTbvEUwCGcFBnsB1Lw4HtVsJxxU/F8UAl+nFVkrXByOqo8pKO/xaWFcduJjaC1i/2NDmLCuuCJnUpoxolRJYwiavPBzBoXc7s2/Wpf0YnD0uXNexU5iMtOWXw/hdj/y/JdUATSkGry09PbfUL4ChHFEqc1YZ6gPonqhEXLIs90WGXhNaawCbCs8JjrRA7vhYHwxG5nLBUsZJYo9TDptvxEYqgG+70SgAw+asNIqeogMNgQREE9IfXVty32ik0LP13GLKuybHZZeCsEcSD1OSummary
Looking at the diagram, we find that stars in the lower-left corner are very hot stars, but are very small, resulting in a low luminosity. We call these stars White Dwarfs. White Dwarf stars represent the end stage of low-mass stars like our own Sun. Stars in the upper-right corner are rather cool stars, but very luminous, and so must be very big. We call these stars Giants. In 5 billion years, our Sun will evolve into a Red Giant star. Even more luminous stars are called super giants,, because they are even bigger than giant stars.
As you can see, when it comes to the H-R diagram, there is a lot of information contained in one simple diagram. Not only does it plot the luminosities and temperatures of stars, but it also shows us that these stellar properties are not random, but depend on the group to which various stars belong. Because various stellar properties are related to each other, we were also able to plot the radii of stars on the H-R diagram, and see that stars come in a variety of sizes. These are just some of the details contained in an H-R diagram. The H-R diagram is an invaluable tool in astronomy.
17.13 Quick Check Quiz
Indepth Activity:The Hertzsprung-Russell Diagram