Chapter 23. Seeing the Milky Way in Infrared, Radio, and X-Ray Light
23.1 Introduction

Author: Kristen Miller
Editor: Grace L. Deming, University of Maryland
The goals of this module: After completing this exercise, you should be able to:
- Explain why space telescopes and non-optical wavelengths are needed to study the galactic center.
- Describe the spin-flip transition of hydrogen and why it occurs.
- Describe the shape of the galactic disk and bulge.
In this module you will explore:
- How galactic dust affects optical (and shorter) wavelengths of light.
- What infrared observations teach us about the stars and dust in the disk and bulge of the galaxy.
- How a special hydrogen gas emission line helps us to map the spiral structure of our own galaxy using radio wavelengths.
- How infrared, radio, and x-ray observations all work together to solve the puzzle of what lies at the center of the Milky Way galaxy.
Why you are doing it: Centuries ago, humans believed that they were located at the center of the galaxy. It is now clear that we are not; we instead occupy a place of no particular distinction midway out in the galactic disk. So then, what is at the center of the Milky Way? The answer to this intriguing question has been difficult to achieve, but with the advent of new technologies and the use of observations at non-visible wavelengths, we are now able to probe the dusty, hidden heart of our galaxy. The answers we have found, as you will discover in this activity, are surprising indeed!
23.2 Background
If you have ever been in the country, far from city lights, on a clear night and looked up at the sky, then you might have seen a beautiful band of light stretching across the sky. This is the Milky Way Galaxy, our galaxy, and home to approximately 100 billion stars whose collective light creates this view. Even more beautiful, more detailed views of the Milky Way have been taken with optical telescopes, both on the ground and from space. However, even the best of these telescopic pictures do not provide a complete view of our galaxy.
Our galaxy contains vast collections of gas and dust, particularly in its central regions that make up the disk and bulge. The gas is not really a problem; it adds a few absorption lines to the starlight that passes through it, but that's all. The dust, on the other hand, is a big obstacle because it scatters and absorbs starlight. The problem is that the average size of dust particles in the interstellar medium is comparable to the size of optical wavelengths of light. This allows the dust particles to very efficiently scatter visible (and shorter - think ultraviolet, x-ray, and gamma ray) light, as shown in the animation below.

Question Sequence
Question 23.1
1jTuu4j9jMRMI4TMQG692cvjC9CulacHADG4VyFBNOLVGzQtT/f6RLv20vGQo4PtaWNr2723KxUhB6FuAd73IkZIFR5vQdS1iqOacczsmcl4gaUXUkKdtuCk2iQkRoK0iWPMSJTL/l+J9Q1+RgPR38BpiKe+1remjcNhMw==Question 23.2
SBeLFW02NU6bUtd3h3ZsQM6JBu8yJT6kgdoeGI9+6b3bI0uKcXvXGjuKYXlLeebH6NYu65gD7C46shZ3fqZctiHT+bndoimHTa0zIR85OuJtlRmd7iaviSb8IFM5nO85CkmIfzmTfabpbAHsuXMMRSx9uSwY3LCnV1Z9S3jD3kQ6IGTlWYErdxCjq4g1QH/+fwb+3fRn/x/XrKlYHmrbbQUmVH6q/IyagiljJSXcIsLKwGK+OP3ADV5gvE/pE9XyEtD7D9HRMWTIONgPHm+d4ua3Hatv1hiGgi+xQEbWJros4QSqfmmpZlEPS3W1gu0ExtwvmCZ/J6+nCo5DOY8YK2aiOrbagFvzPQd7gqpwfYHKXiE4ZefWWEzbxDeV2uwG6vZJRflPHpbW5EbpTbLQ/p+5TfapWo436kxDJcgCqbq0Fdoh3vjoGMrmolwmZ2vVIRw2/XEfyLgHiErolirXuLt7LFqOW4Q4GlUzTv29KxIMBRNDt0Fn0I6jxHpwF0qHwMRWbeGnCM8qhvf8Wc6Gz9ZQ7oQlE3+G6PzVwndA1xHUITumBU6Q6WfUcnuMApDXDNJw8lCkORt8gzcWwV28QomVcy8nkynsMYjmTBRk5dCnbECvQuestion 23.3
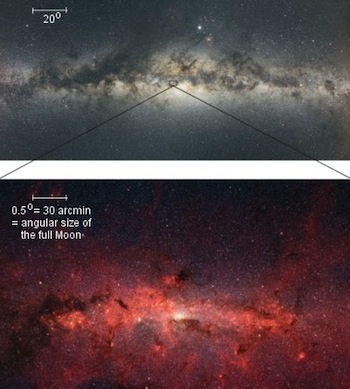
Because there is so much dust in the plane and bulge of the galaxy, stars in those regions are affected the most. In fact, the central regions of our galaxy are completely invisible to us at optical wavelengths due to dust obscuration! This means that literally millions of stars are completely and totally hidden from view when we look in the visible portion of the spectrum; these "dark" regions dominate the image of the Milky Way shown above.
In order to truly see the Milky Way, we must turn to other wavelengths of light. In this activity, we will see what we can learn about our galaxy by looking at Infrared, Radio, and X-ray wavelengths.
Ds4a0hYduqCkNHEVK8TcHidYM+4bHP/2zUyASBg5SYlS2ZXNqVnNh7NiTDaX9Bwd/Iu7Q8bd8baoomIgkDh3JwKN2svTFGA/mVnD020Pig7pYQJy9rrDl+ra9DHoUSMMRhmxzBzUVL7ywBYl8m0Do67cpesyjUnh02vI1Yqv00rpbxRwrjWG18XgH57Kw56dBZ4f7M6HeG6Vpjq2oytB1fSGCOmtvU4qg2Xdts5gJmOE/uCVNvMq1jJB/NQOcmO/xFy6WRswG2+96Fht23.3 Warm Dust

Infrared wavelengths, which are longer than visible wavelengths, are not significantly obscured by dust. On the contrary, the dust itself, when warmed by starlight, emits strongly in the far-infrared. The far-infrared wavelengths range from 30 to 300 μm: this is the part of the infrared region that is closest to radio wavelength and farthest from visible wavelengths (hence the name). In fact, dust emits more strongly than stars at these wavelengths, so infrared telescopes can study the distribution of the dust itself. Because there is so much dust in the plane of the galaxy, observing at far-infrared wavelengths allows us to map the shape of the galactic disk, as shown in the picture above.
Question 23.4
hrCzv9cUP73FIOtL56fbC9WUFVHMEQ37HUTKlEnj7/+ltbXke/kUlbXBZtxZJB1RMHudf0e6QQV4UCzPLfXE2fVbDs8c3DIuxocjvPzpwko2QDavwupCAX9auakmQE0QqfPIAzJoZLz7c8wsNNRsU2q1S+mH72HCO0SYbP39BiCQQMlrj+f77mlLu4tAsgr9BLUrSYSFCrcc1MsLfE4coi+X63fK3wvivfXDr8WXmPRYjzRP646bIkJPUL4PZDNvtayYdVN/RKoEGeDGv9ulH+gcWFjqoCDw8Tc57c9aFftcjZ9qIxfjMTfHEv5inzhSTJm/Vurog8/O975ZdG7hJ2vWJZReHNtbgZxg+PiGH5djlRhnKczFdbNm7XakNgA7742PFw==Summary
While infrared light is essentially completely absorbed by Earth's atmosphere, the advent of space telescopes has allowed us to utilize this tool to investigate the structure of the Milky Way and other galaxies. The images from such telescopes indicate that the disk of our galaxy is long and very thin - 50 kpc in diameter, while only a mere 0.6 kpc thick.
23.4 The Near-Infrared

The near end of the infrared region - that is, those wavelengths that are just longer than visible light - can also be used to study the central regions of the galaxy. Because these wavelengths are larger than the size of most of the dust particles in the galactic plane, they are not significantly affected by interstellar absorption and are thus able to be observed by space telescopes. The dust itself is too cool, even when warmed by starlight, to emit at these wavelengths. Instead, the near-infrared light we see comes from the stars themselves, mainly from cool red giants and supergiants. Thus, we are able to observe the actual stars that inhabit the inner portions of our galaxy - stars that are completely hidden from us at visible wavelengths! This makes near-infrared observations a very important tool for discovering what lies at the galactic nucleus!
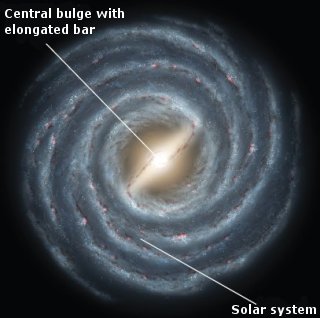
At these wavelengths, we find that most of the stars in the Milky Way lie in the central regions of the galaxy. They are found throughout the thin galactic disk, although they are much more concentrated toward the central regions, as can be seen in the figure above. Near-infrared observations also reveal that there is a bulge at the center of the galaxy. This bulge is a highly concentrated distribution of stars that is about 6 kpc in diameter, and 4 kpc thick. The distribution is not spherical, but elongated. In fact, infrared observations by the Spitzer Space telescope of 3 million stars in the central galactic bulge have confirmed that the Milky Way is a barred galaxy, which means that its central bulge is elongated like a bar. The spiral structure (discussed below) that we see in the galaxy emanates from the ends of the bar. This is shown in the figure on the right.
Question 23.5
XOGqYFpdv2Yzn7OkKQqEoqNfeQP03wI3ZyP5MpVUUHRgUsCxOztFLZu6QzXfZ3W4Gz1kqslr6SSE23ANNXGDLZ8NfOmKOslAJ2z/PjzJBBrEz1hXY8NS8fZBdULLdoKVFHKwQA/O56tJEtaMIkTC5V7cjr9XvmSxWZ6psTRdn4967/qGay7RBZ+OURcywaVfQc8adMwZH3R6Ef03z9Vle8qTF0ymdsFtMPzWFfYbGYC+g6JpUNZA3CFFBUNuUzk1XFa4LTyxMwA=Now that we have seen what we can learn from infrared light, let's try even longer radio wavelengths!
23.5 21 cm radiation
While infrared radiation allows us to view the dust and cool stars in the galaxy, radio waves can show us the distribution of the galactic gas, including hydrogen. This is important because hydrogen is the most abundant element in the entire universe, and thus it is the main constituent of the galactic gas. The long wavelengths of radio waves can pass through the obscuring dust even more easily than the infrared and can even penetrate the Earth's atmosphere at certain wavelengths (from about 10 m to 1 cm), known as the "radio window". All of this means that radio waves from the galaxy are very useful and fairly easy for us to detect and study.
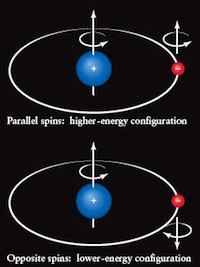
Cold, neutral atoms of hydrogen gas emit radio waves due to a process called a spin-flip. The particles inside a hydrogen atom - the proton and the electron - all spin on their individual axes, just as the planets rotate while orbiting the spinning Sun. The rotational axis of a planet (ie, the imaginary line about which it rotates) can point in any direction, depending on what happens while the planet is forming. The spin axis of an electron or proton, however, can point only in certain, specific directions. An electron's spin axis can either point parallel or anti-parallel to the axis of the proton, as shown in the figure below. When the electron changes its spin axis from parallel to anti-parallel (or vice versa), it emits (or absorbs) energy and is called a spin-flip transition.

To understand this transition, imagine you are holding two strong magnets in your hands (as shown in the figure below). If you hold them such that like poles are facing, you have to push really hard to bring them close together; this is known as a higher-energy configuration, because it requires work to maintain the position. This is just like having an electron and a proton with parallel spins: they are held together by the force of electric attraction, but it takes work (or energy) to keep them that way. Now imagine that you turn one of the magnets such that opposite poles are facing each other. This time, it is easy to bring the magnets close together; in fact, their mutual attraction does most of the work for you. This is a lower-energy configuration, and it is analogous to having an electron and a proton with anti-parallel spins.
The difference in energy between the parallel and anti-parallel spin configurations is very small, corresponding to a photon with a wavelength equal to 21 cm. This 21 cm radio emission, as it is called, allows us to detect hydrogen atoms in the galaxy as they spontaneously move from a higher-energy parallel configuration to a lower-energy anti-parallel configuration.
Question 23.6
pZ7w0eqyFWY5/p3MHWycq0mlzgG45Ews2j8F4MRPajqZQsjdbMcSQsdGwrOKTaiYk+8C9DPAOpjv8cevrHl18BU2xf53uohzqArsXyv+pHDi6MBPhsf2woJrGYIzVoV8Kt+26HBgKbF8Up/46ShgtyVSNdYqR1FBlWSl0/4kgP95rqHrU3cfFTF+GySBCO12/VHhVTZRLqt+ZpON8XSYeAoupdp9EIeJ1Khj5VvhPUAPXbSZEVbUXHzT6KnI2/6apKr2SmxnnAcjCog5gsuCF7KXiOo6tTlo/oFlvv0FwWb1B2ucpj9/m2bIV/0cNm68yD13E7rNZgx+DOl1XLxZ3CMRg9H+rrB+jm4Cy3m9E3L6+C7SqOvwIiNqJ8Pv1lTnnFiifsuxOF1lf685dbC1lvW++iSTyuaD2m9GRQEFkP4EzfZ5mJyxs6bJerE=23.6 Spiral Arms
The figure below shows what we see when we look for 21 cm radiation. Just like the dust, cold hydrogen gas is concentrated in the plane of the Galaxy, although emission is found at radii far from the galactic center as well as close in.
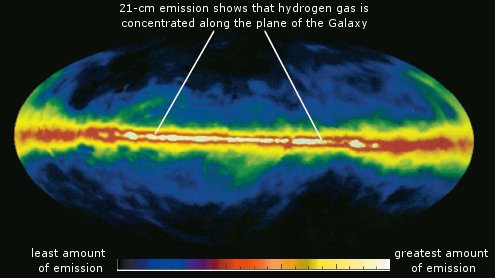
Studying the distribution of 21 cm radiation in the galactic disk allows us to map the spiral structure in our galaxy directly. Cold hydrogen gas tends to be clumped in the spiral arms, so the spin-flip emissions trace out the arms themselves. Detecting this emission demonstrated definitively that the Milky Way Galaxy is a spiral galaxy! Click on the animation below to see how 21 cm emissions allow us to "see" spiral structure.

Question Sequence
Question 23.7
W1eKGiX0f/VCXz0IW/aZhtYd77zeRnreDzVwsCfybchTvg2jmw7IDpS41A0R7Emtl/nnNQz0mwKMM8lsHqgXTMeDCILP02aUmCNdlD/Ssvbsf3kdrCHTBfACHN55tdQxf+EHYvF3JLLVqhW0Fz4www+jhGrPrifGuXFx9xaAnlJh6DhCcvUy5dhJpi9sz3EiKUaxhFqdVD6RKfHvQuestion 23.8
JywM0kc+p+iBTgqdvaeVye/O4t0vaSw4JJB0XMYidKXkJ3MMgM4gDrQQM/rzR6HNIyO7xXZV2fGzHYNxIvjXqjUxbyKHxYnLdm77qvsF53wfnj7lRiTBYghAroaMjHb8yCitm4/OmNn1D/EgpauvXmVjtAe9VX991+IF05UegLi/JCsEK1TQLTBVALks9JfRFA9yDwQqfOiJxHokzy+CpGtOmnH+l9T9+YVS4lASA9c5rCv2cxUEZQ==Summary
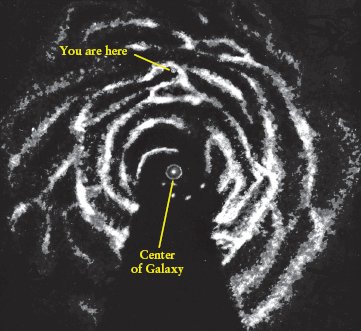
As astronomers detect shifts in the 21 cm line (due to motions toward or away from us), they associate that light with different positions on different spiral arms. This allows us to determine exactly where the radiation originates and to map out the details of the Galaxy's spiral structure!
Material in the wedge that is missing in the figure is moving perpendicular to our line of sight. It thus has no Doppler shift, so we cannot identify the position of the spiral arm from which the emission we see originates.
23.7 The Galactic Center: A Long Wavelength View
Radio and infrared waves also provide clues to what lies at the very center of our galaxy. Radio telescopes have found several very intense sources of radio emissions located very close to the center of the galaxy. One of these sources, termed Sagittarius A* (Sag A*), is found at very nearly the exact gravitational center of the entire galaxy. The radio emission we detect from Sag A* is known as synchrotron radiation. This is radiation that is produced when high-energy electrons are caught in a strong magnetic field. The filamentary nature of the gas near the top of the figure is likely due to ionized material being organized by a magnetic field. It seems that whatever is at the heart of the Milky Way is associated with very powerful magnetic fields indeed.
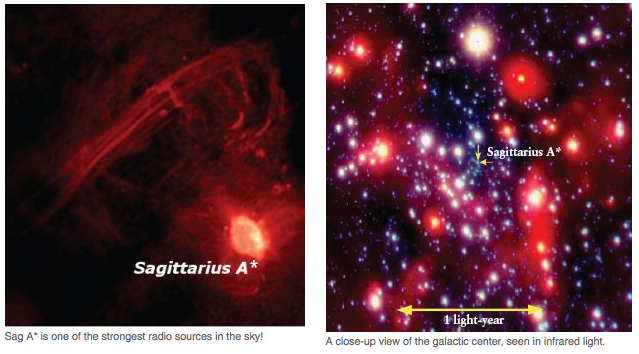
Infrared radiation allows us to detect literally hundreds of giant stars very close to Sag A*. These stars are within one light year of the galactic center! (For comparison, the closest star to our Sun is about 4.3 light years away.) The central regions of the galaxy are certainly very crowded and very bright! This is shown in the figure above.
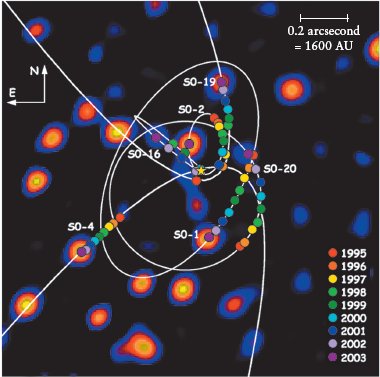
Infrared observations have tracked the orbits of many of these stars. They show that the stars are moving at very high speeds, many greater than 1500 km/s. (For comparison, the Earth orbits the Sun at only 30 km/s, and the Sun orbits the galactic center at a mere 220 km/s.) One star has even been shown to have an orbital speed of 12,000 km/s, which is 4% of the speed of light! The orbits of these stars are small and are centered on Sag A*, as shown in the figure above and in the following animation.

By calculating the orbits of these stars, we can estimate the mass of the central object; the speeds and tightness of the orbits indicate that it must be very massive indeed - 3.7 million times the mass of our Sun! Because many of these orbits are very small (astronomically speaking), the object they encircle must also be very compact. Thus, infrared and radio observations lead us to an exciting conclusion: a supermassive black hole lies at the center of our own galaxy!!
Question 23.9
qlHYJx3ep+1wh3RKkAKEmz6FW885hrO9LZr6moF9sso+j1XDJ4xTDBKQi4iocL3t2rwd2oN2RIU7uTMK5q0PGIbC14f0OOQmBJLGDeGf1u7biBmrVg8nlIgRtDOMcE1hAPItuI5hZy++qAaT/eW+aXateNlm980MJu1mfuZ37d0E1sryV4CZAADn/7jQKgAqMrcud/XIVzsEGQDbF38QpOoeGktWMWuwDOOZVbK+yWu94184Jz2y3P0OqO5oLtu7kurTSV0z+FQFGxdUWczIix2ml0wk0U4J0lwME+8TNKxvLvX9f7B58V1xDnnUXcBpsMABp5GYA7VlKW8iNTwzAovwCtvQuljwjrFPi25mYyHnfNgHWBTEvDV4hph7qNU9egCmw7cWfniGvqsH9s98KQqqA6099x0d4VMqEocqo4l5OAnhO17CggUT0LMU9PcvMOSuP+zeTifbHvVoxzjtJBodnyII/buAXfobgm4/yMTcxqPBuxQyGFk3cyk18Mz2kohrJ7UFUwd6xfX7BwQAhnQYy+Il0TxlhqeITg5vRn7NDZT7OQUHpfp0ztftt1eAtKKPcC8VcECcm1B70TZTEcz+7JcFjphI2CdvcbpyqEQpqEqUUlHcBQMcZeJ9D0abd4EJc4bVmVIRO9n6siJaDCJlaSEIvH02gtk9YoaLgnVBP6IQKh7IMcJiLazxwe4BCZS9Bgo2lxw=23.8 The Galactic Center: In X-Ray Vision
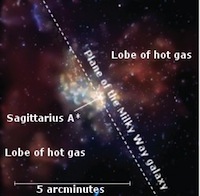
X-ray observations of the galactic center support this conclusion. X-ray emissions have been observed from the galactic center, confirming that Sag A* is a strong source of x-rays as well as radio waves, as we would expect from the region surrounding a supermassive black hole. These observations also show that lobes of hot gas are found symmetrically on opposite sides of Sag A*. The formation of these lobes is shown in the video below.

These lobes represent explosions of large amounts of hot, ionized gas, which occur as a black hole swallows orbiting material. The explosions move away from opposite sides of the central black hole, perhaps guided by strong magnetic fields and (likely) by the presence of an accretion disk surrounding the black hole. The disk effectively blocks movement of material along its plane, creating the symmetrical appearance of the emitted material.
In addition, the Chandra X-ray Observatory has detected X-ray flares - short, strong, bursts of x-ray emission - coming from Sag A*. The flares become very bright within only a ten minute time period. This means that the source of the flares can be no larger than the distance light travels in ten minutes; otherwise, the variations would be wiped out by the source's rotation. In ten minutes, a photon of light can travel about 1.2 AU, a little more than the distance from the Earth to the Sun. So, Sag A* is a very small, compact object, yet it has a mass millions of times greater than the Sun. Such observations provide strong evidence that Sag A* must be a supermassive black hole.
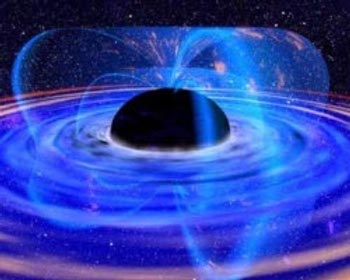
To the right is an artist's rendition of what a black hole looks like: The black sphere at the center represents the point at which light cannot escape from the black hole. The black hole itself is surrounded by a disk of accreting material. A strong magnetic field emanates from the black hole and interacts with the disk.
Question 23.10
IZANO/301SxSyA7irMXMsIzq4uDVC/3OsUEQYOc858r6pw5fINzrfTlL94yUaFstNaiew2nIRcfYo/CJusNnGI6rsD6XHuAZ6o47V0s0GhsE/p6j3HPzJqf+UFZuf9F/9lJidmHWYwkiLThICw+4NfVNgv/7ymdcxhdHK9yK5o+GszKj/8MMIYDVHvEpn0XCOP73BTEUowtnQNVGnDB1+01p4UZkRb+oh0Wz/TvW+wHb5Ih35MkZcIuzaRyEuzwh1Yw139sFGo983gDajV0Vbug16u1qDOteAF/KZ0MtQdLP2Tlgnay4R2BWqnnUeby6MAdzS71xARnje4Oilk1774cyQLwS1zCWfjzYZp50fAhziemCsxC8b+JjLqZXqTRdJ6IrK4N6rz5k0jre+QQ05xqlEcEP2Yh2/WodqtwCXNJ4gW6nzUoIiA1rr1ft2huR8Iu7k+dfXzIRM3M8cBZEcnwL0tEaeiUjAMOlIXr+uF0oY4W8GGcK3GSpdZfFUy6Arq31j/Rkh4AT14kqEGjsWropM+RB2NOx40u3TkrkPf3synVkF+XaR6IYfRZvfyiacalbg96ivmPadz9cH+5eFVSJ7PRkHBM6EpXDnGcvLqge5Qus81jijeizJxBs7ovXrRkDHMboJN/6QCxFP5FJIuo+P8bvnAtJBp1miZN0pO35yjPLr5wk64EhXGudXuGzoDraeawlolLmxYVFZ8UVHg2Jvd6hp/WsCuEKtkDF+sp4X/i6zpZovX+CBbDU3q7CKzA7nAILhtEUxRmE6r5dtHCKQ1jN4SWFlPWMrw==Summary
In this activity, we have described in detail the planet and center of our galaxy, aided by observations of non-visible light. Radio, infrared, and x-ray emissions have shown us the true size and shape of the galaxy as well as details of its spiral structure. They have also given us strong evidence for the presence of a 3 million solar mass black hole at its center. It is truly amazing how much we can learn by observing light that our eyes cannot see!
23.9 Quick Check
Indepth Activity: Seeing the Milky Way in Infrared, Radio, and X-Ray Light