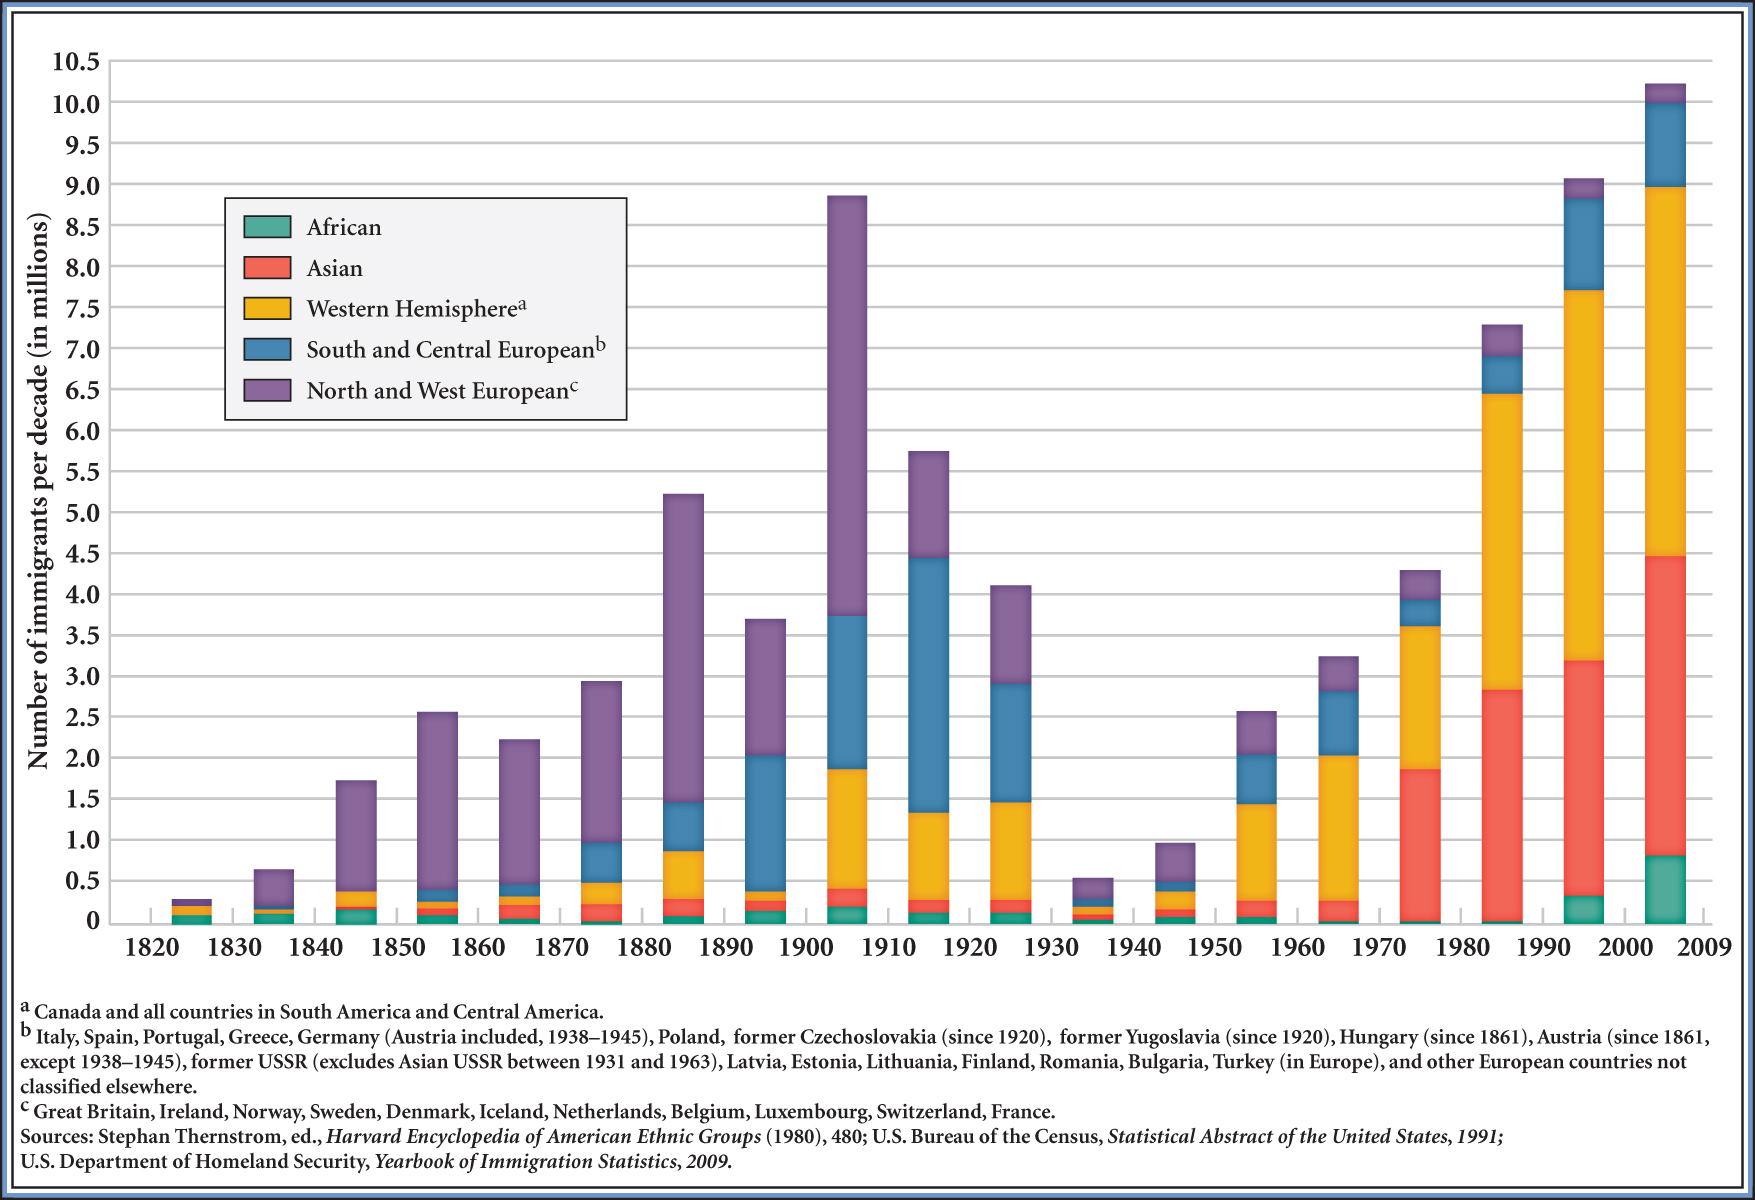
Changes in Immigration from 1820–2009 (chart)
Despite politicians’ beliefs that the Immigration and Nationality Act of 1965 would not drastically alter migration patterns to the United States, quite the opposite occurred. Between 1965 and 2010, the numbers and groups entering the United States rapidly increased. As this chart indicates, the 1965 Immigration Act and the acts that followed created opportunities for a greater number of varied groups to come to the United States. The abolishment of race-based quotas found in earlier legislations such as the Chinese Exclusion Act and the Immigration Act of 1924 allowed for those who were previously excluded to settle in the United States in the “Fourth Wave of Immigration.”
Charts, graphs, and other forms of statistics produced by national, state, and local governments reveal the importance of the Immigration and Nationality Act of 1965 on the history of immigration to the United States, as well as the continued influence of the act on migration. Historians often rely on statistics and visual representations of statistical patterns to chart the effects of the 1965 Immigration Act. Such tools are one way to gauge the changes in the racial and ethnic makeup of the United States over the past two hundred years.
Evaluating the Evidence
Question
h2pcwE+5yV/YguPvsTmmyWeeFeOvpGmltPmFx6HH5P1kYV66Qw7QVGc3qBogxrlGXwk4lEVmuVEBKdGfkWGrp3AR9EB8a4qv6AZ5l3fN4AuCa4ATJtKolu+tqxLcgCnU00RJZuf5Juxd7zD3f/bOKwMpEL1CzPj8M6GjEfpgKKIQUrmxQuestion
1saU+bCVE/W8QZM8alRXCurCjxJmQiXeXP3sbEyBRBgDRG7H8NlK+SVMpR+nZkZ9sWS0Yj/oADENQiPGOQ3qAzD6PxwQ23NdiEQNckdyVg1p7twj4AUiKUEmJnfxH3CgMxaEMsITMHMvGqTSho9IrPBvP1pWrMG8L0pUhUsGb5UsLQ+dYuDf06LECH8EM3g6DRf0NHnx0VKfQQgtwpRMzg==