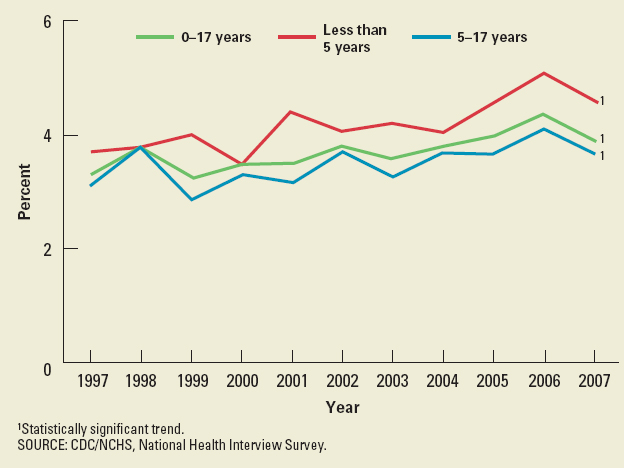
FIGURE A.2
A Comparative Line Graph Showing the Percentage of Children with a Reported Food or Digestive Allergy from 1997 through 2007 by Age Group. Source: The Centers for Disease Control and Prevention