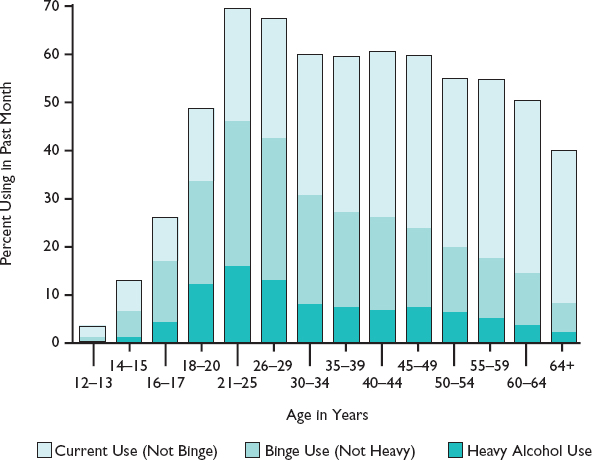
FIGURE A.3
A Bar Chart Presenting Numerical Comparisons. Source: U.S. Department of Health and Human Services, Substance Abuse and Mental Health Services Administration, Office of Applied Studies