B | Integrating and Crediting Visuals
| B | Integrating and Crediting Visuals |
Visuals in your text can engage readers, convey information, and reinforce your words. The MLA and APA style guides divide visuals into two groups:
Tables are grids that clearly report numerical data or other information in columns (running up and down) and rows (running across).
Figures include charts, graphs, diagrams, drawings, maps, photographs, or other images.
Q-8
Much of the time you can create pie charts, bar graphs, or tables in your text file using your software, spreadsheet, or presentation options. Try a drawing program for making diagrams, maps, or sketches or an image editor for scanning print photographs or adding your own digital shots.
When you add visuals from other sources, you can photocopy or scan printed material, pick up online graphics, or turn to the computer lab for sophisticated advice. For a complex project, get help well ahead of your deadline, and allow plenty of time to learn new techniques.
Select or design visuals that are clear, easy to read, and informative.
To present statistical information, use graphs, charts, or tables.
To discuss a conflict in a certain geographical area, supply a map.
To illustrate a reflective essay, scan an image of yourself or an event.
To clarify stages, steps, or directions for a process, add a diagram.
B1Position visuals and credit sources.
Present each visual: provide a context for it, identify its purpose, explain its meaning, and help a reader see how it supports your point. Following your style guide, identify and number it as a table or figure. Place the visual near the related text discussion so readers can easily connect the two.
Solve any layout problems in your final draft as you arrange text and visual on the page. For instance, align an image with the left margin to continue the text’s forward movement. Use it to balance and support, not overshadow, text. Let the visual draw a reader’s eye with an appropriate—not excessive—share of the page. To present a long table or large photograph on its own page, simply add page breaks before and after it. To include tables or figures for reference, such as your survey forms, place them in an appendix or collect them in an electronic supplement, as APA suggests.
Acknowledge visual sources as carefully as textual sources. Credit material from a source, printed or electronic, as you present the visual. Ask permission, if required, to use an image from a copyrighted source, including most printed books, articles, and other resources; credit the owner of the copyright. If you download an image from the Web, follow the site guidelines for the use of images. If you are uncertain about whether you can use an image from a source, ask your teacher’s advice.
B2Prepare tables using MLA or APA format.
If you conduct a small survey, use the insert or table menu to create a simple table to summarize responses. Supply a label and a title or caption before the table. (Italicize its name if you are using APA style.) Double-space, add lines to separate sections, and use letters to identify any notes.
Q-9
TABLE FORMAT FOR PRESENTING YOUR SURVEY FINDINGS
Label with number
Title or caption
Letter keyed to note
Column headings
Pair of rules or lines to enclose heading
Rule or line to mark end
Note of explanation if needed
| Type of Support | First-YearStudents(n = 20) | Other Undergraduates (n = 30) |
| Scholarship or Campus Grant | 25% | 20% |
| Student Loans | 40% | 57% |
| Work Study | 20% | 7% |
| Family Support | 50% | 40% |
| Part-Time or Full-Time Job | 25% | 57% |
| Employer or Military Contribution | 10% | 17% |
| Other | 5% | 7% |
a. Percentages based on the total number of respondents (n) were calculated and rounded to the nearest whole number.
If your results came from only a few students at one campus, you might compare them with state or national findings, as in the next sample table. When you include a table or an image from a source, credit it, and identify it as a source (MLA) or as adapted (APA) if you have modified it.
TABLE FORMAT FOR MLA AND APA SOURCE CREDITS
Label with number
Title or caption
Column headings
Spanner heading (for all rows) centered
MLA source credit
| Institutional Characteristics | Any Grants | Any Student Loans | Work-Study | Veteran Benefits |
| Public | ||||
| 2-year | 50.5 | 17.6 | 1.9 | 2.9 |
| 4-year (non-doctorate) | 55.3 | 39.4 | 5.3 | 3.2 |
| 4-year (doctorate) | 59.9 | 55.5 | 6.2 | 2.8 |
Source: Radwin, David, et al. 2011-12 National Postsecondary Student Aid Study (NPSAS:12): Student Financial Aid Estimates for 2011-12. National Center for Education Statistics, Aug. 2013, nces.ed.gov/pubs2013/2013165.pdf.
Q-10
The credit above follows MLA style; the credit below follows APA. At the end, add the date and name as any copyright holder requests.
APA source credit
Note. Adapted from U.S. Department of Education, Institute of Education Sciences, National Center for Education Statistics. 2013. 2011-12 National Postsecondary Student Aid Study (NCES Publication No. NPSAS:12), Table 1.
B3Add diagrams, graphs, charts, and other figures.
Select or design figures purposefully. Consider your readers’ needs as you decide which types might convey information effectively. A diagram can help readers see the sequence of steps in a process. A graph can show how different groups of people behave over time. A sketch of an old building can illustrate the style of its era. Add a clear caption or title to identify what you are illustrating as well as labels for readers to note key elements, add numerical or textual detail, and use visual elements—size, shape, direction, color—to emphasize, connect, or contrast.
A diagram can simplify a complex process and clarify its stages. Figure Q.1 shows the stages in the studying process.
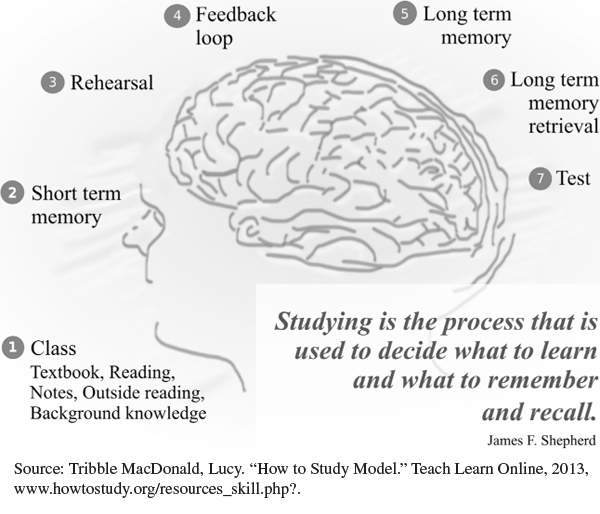 Figure Q.1: Figure Q.1 A Diagram Showing the Study ProcessFigure Q.1: Lucy Tribble MacDonald.Source: Tribble MacDonald, Lucy.“How to Study Model.” Teach Learn Online, 2013, www.howtostudy.org/
resources_skill.php?. A comparative line graph can show how trends change over time. Figure Q.2 illustrates how driver distraction contributes to accidents.
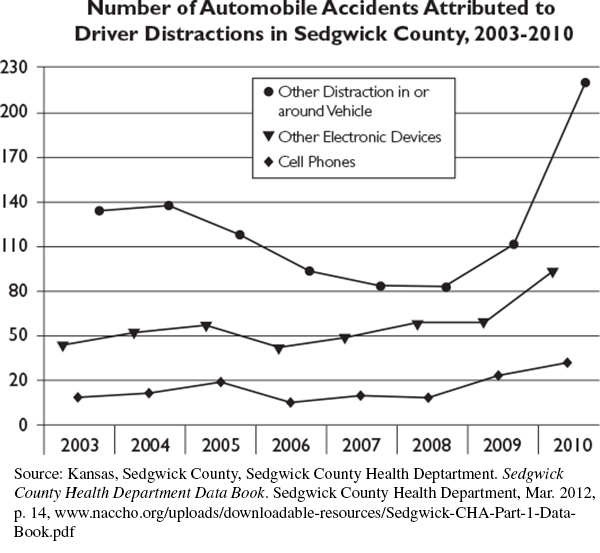 Figure Q.2: Figure Q.2 Data Represented as a GraphSource: Kansas, Sedgwick County, Sedgwick County Health Deptartment. Sedgwick County Health Department Data Book. Sedgwick County Health Department, Mar. 2012, p. 14, www.naccho.org/
uploads/ downloadable-resources/ Sedgwick-CHA-Part-1-Data-Book.pdf.
Q-11
A column or bar graph can compare relative values. Figure Q.3 illustrates the same data found in Q.2 in a different format.
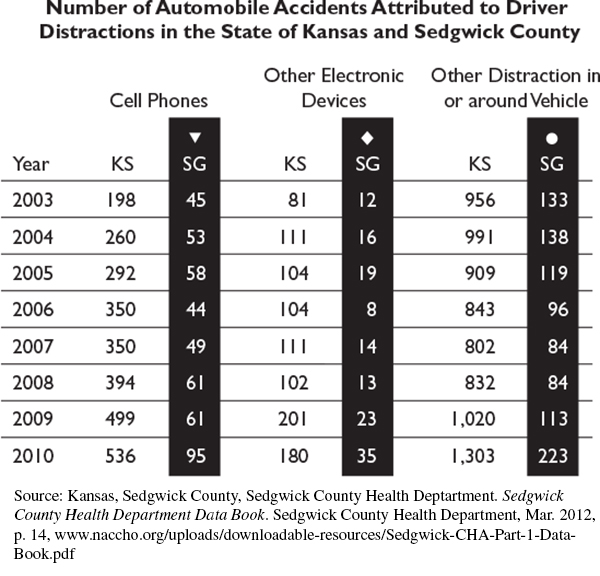 Figure Q.3: Figure Q.3 Data Represented as a TableSource: Kansas, Sedgwick County, Sedgwick County Health Department. Sedgwick County Health Department Data Book. Sedgwick County Health Department, Mar. 2012, p. 14, www.naccho.org/
uploads/ downloadable-resources/ Sedgwick-CHA-Part-1-Data-Book.pdf. A map can present geographical or spatial data. Figure Q.4 shows the geographical range of the Great Lakes basin, which was the subject of a collaborative FEMA study.
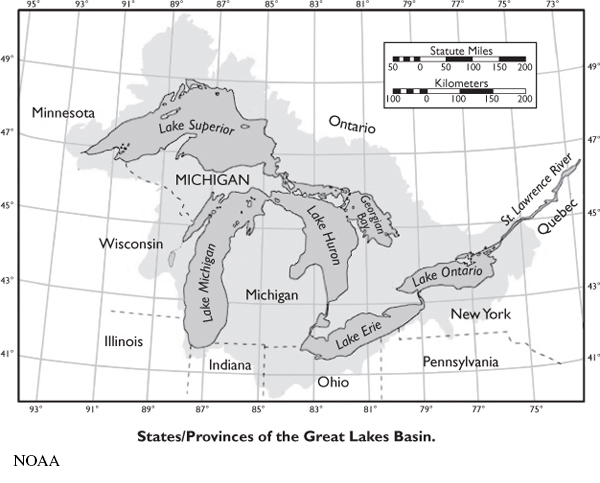 Figure Q.4: Figure Q.4 Map